-
Why we still might have a recession and the impact.
Most of the talking heads and saying we will not or most likely will not have a recession. Here are a few indicators that say otherwise.
- The Yield curve is severely inverted. This means the 2y note has a higher yield than the 10y note. Usually a longer term means higher yield. Why buy a 10y when the 2y is more profitable.
- The full impact of the slowdown has yet to be felt from the Fed hikes.
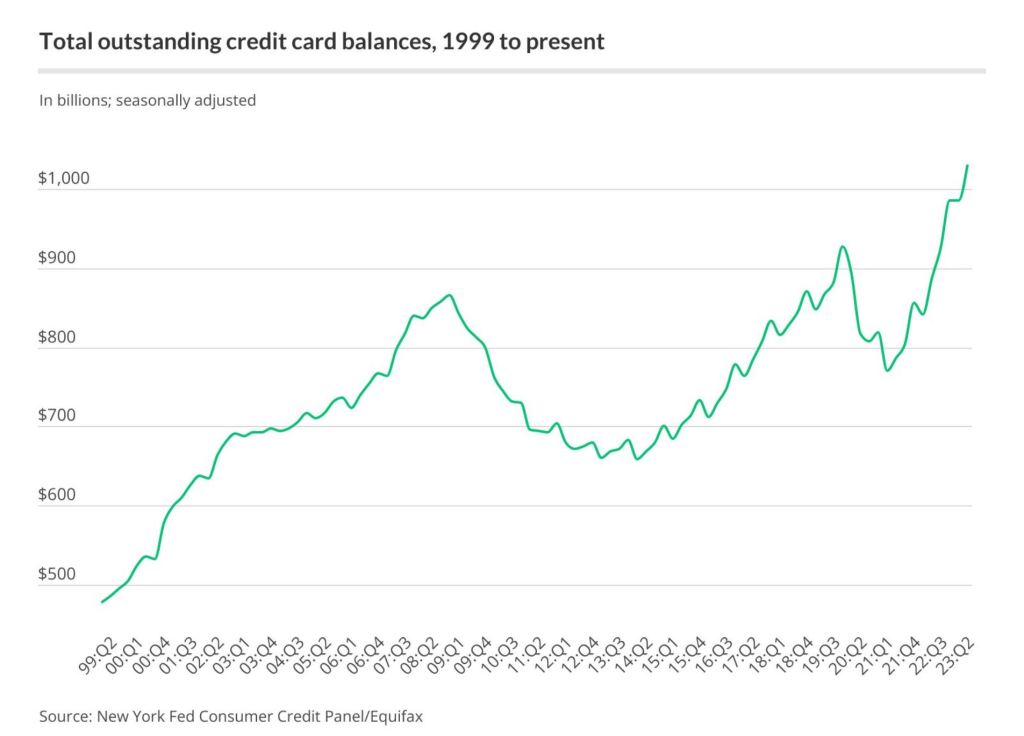
- A lot of consumer spending but a lot on credit cards now surpassing $1T in credit card debt.
- Student loan payments start October 1st.
- Excess savings from the stimulus was $500B in march but is now $190B in June. this money will go away in the next month or so.
-
The battle over Inflation is over, or is it?
The Fed Minutes released yesterday show a consensus that the US economy will not enter into a recession. You would think this is good news but from the Feds perspective the battle over inflation persists and more rate hikes may be needed.
The labor market continues to outperform expectations. The Feds are looking for weaker job figures before calling it quits on the hikes.
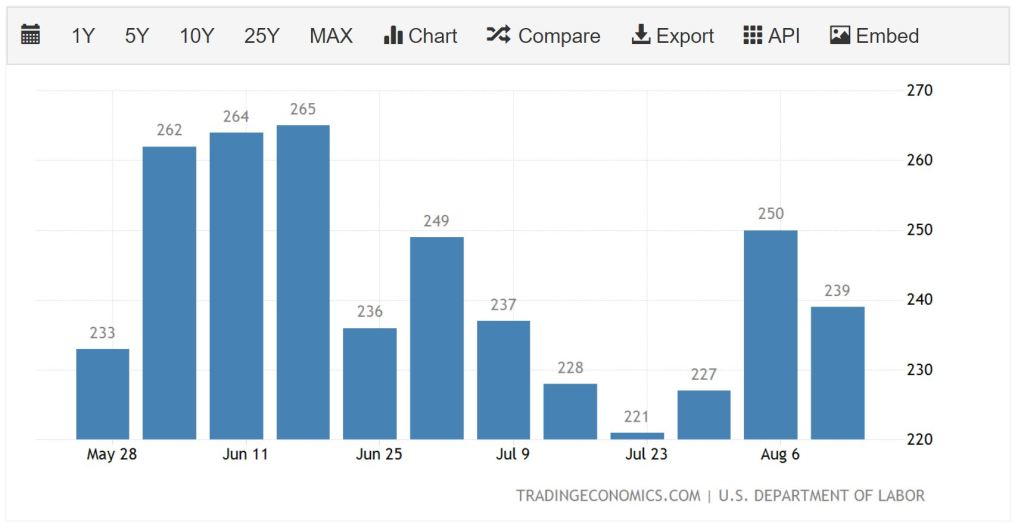
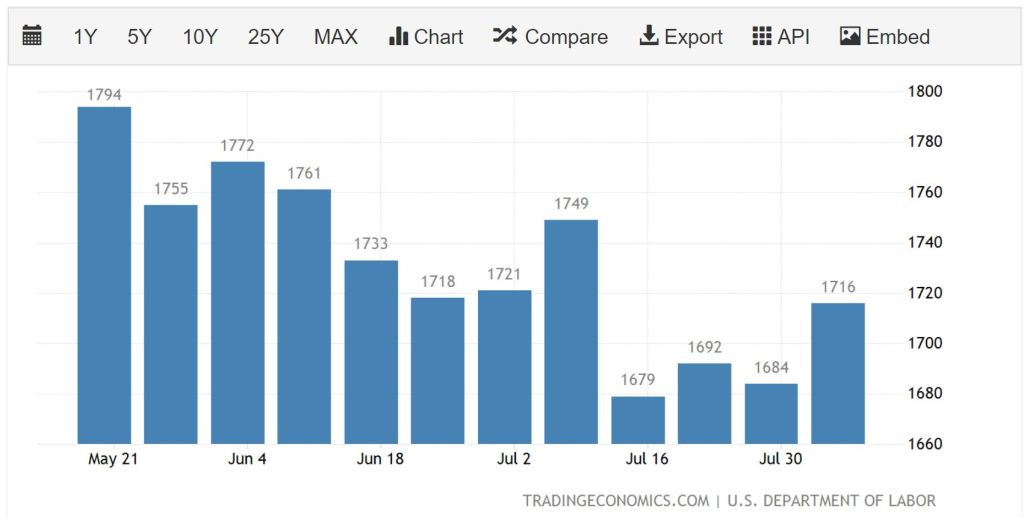
Initial Jobless Claims fell 11,000 to 239,000. Continuing Claims rose 32,000 to 1.72M. Employers are holding onto the employees they already have.
First graph is Initial Jobless Claims, second graph is Continuing Claims.
-
Supply and Demand, I demand more supply -Housing Market
Supply is not keeping up with demand. It’s a problem with solutions that take time and interest rates dropping.
Everyone is holding onto their homes with low interest rates, Builders are nervous to over extend their capacity and be stuck with homes they cant sell for the profit required.
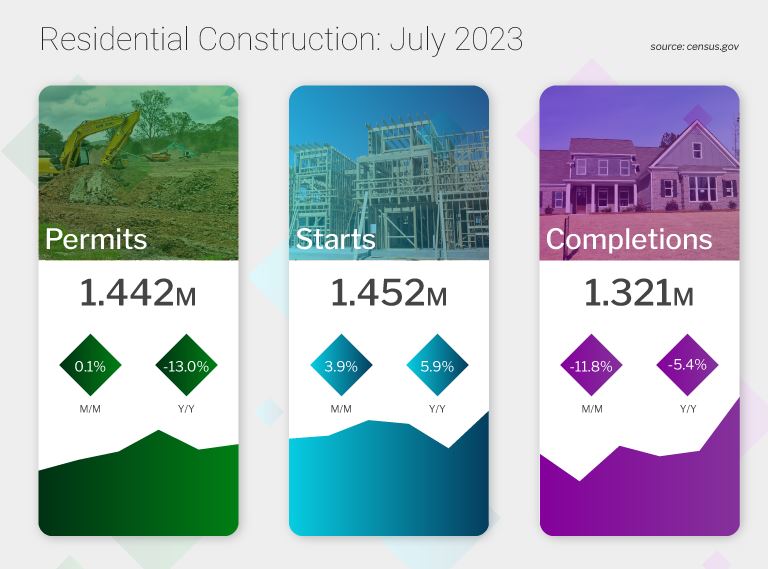
Housing starts were up 4% in July to 1.452M. Single-family starts rose 6.7% in July to 983k. Starts are up 9.5%. But it’s just not enough.
Housing Permits i.e. future supply were flat last month at 1.442M units. Down 13% from last year. The last three months have seen higher starts and permits but still not enough.
My opinion is rates have to drop to shake loose all those homes that people cant afford to sell and buy the home they want.
-
Retail Sales Up, Credit card debt over $1T, Home Buyer activity.
A bit of a conundrum that is coming to roost. Retail sales in July were up 0.7%, almost twice the estimate of 0.4%.
Spending online at restaurants/bars and non-discretionary items topped the list. There is what’s called the “wealth effect”. It happens when the Stock market rises and makes people feel more wealthy and more comfortable spending.
Freight Index came out and its shipments fell 1.2% and now 9% lower year over year. Shipping costs has fallen 17% from last year. So what’s the deal? Less product being shipped but more consumers purchasing non-essential goods.
Credit card debt is over $1T and the rates are approaching 25%. Servicing that debt is becoming more and more expensive.
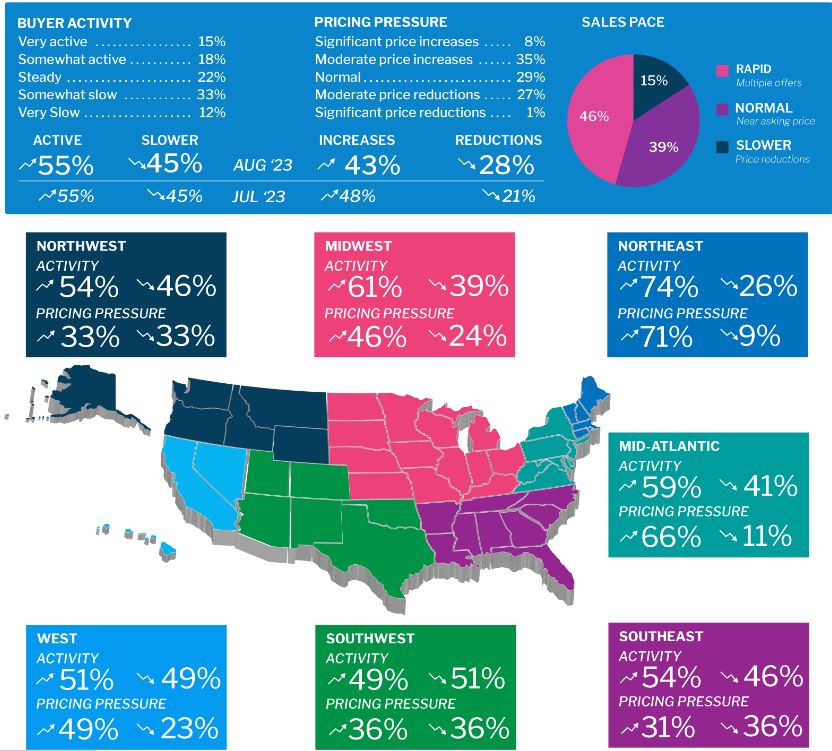
Below Home buyer activity Nationally.
-
Imputation and why it’s a big deal.
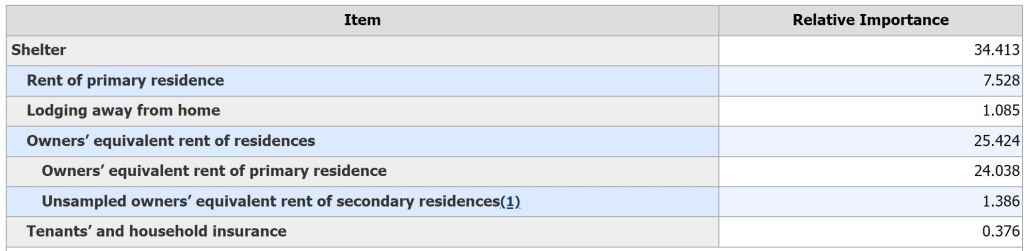
Last weeks CPI-Consumer Price Index includes Shelter costs – Rent rose 0.4% in July and 7.7% year over year. Shelter cost account for 2/3 of the CPI number.
But here’s the question: how does the industry measure or attain that data?
One of the measurements is called Owner’s Equivalent Rent or OER, which tries to capture an increase in homeownership costs and help direct individuals to either buy or rent based on monthly cost. This is done by survey only with no real hard data. This is called Imputation.
-the assignment of a value to something by inference from the value of the products or processes to which it contributes.
The question to the homeowners is “what would you rent your property for?”.
The point is there is hard data and then there is soft data. The Fed is making decisions based on both. Shelter costs are a big component of the CPI Consumer Price Index.
Have a great week and always feel free to reach out.
-
“You miss 100 percent of the shots you don’t take.” – Wayne Gretzky
Too often we sit on the sidelines or push things off for the next day.
The Real Estate market is what it is and if we wait for it to chance or wait for the rates to drop, we miss the shot.
Home prices continue to go up more than offsetting any delay in purchasing for a lower rate.
An interest rate of 5% on a home that has appreciated 10%while you wait gets you nowhere.
On a soap box today. Road trip so a bit punchy last few days.
Get out there and take on the world, its there waiting for you.

-
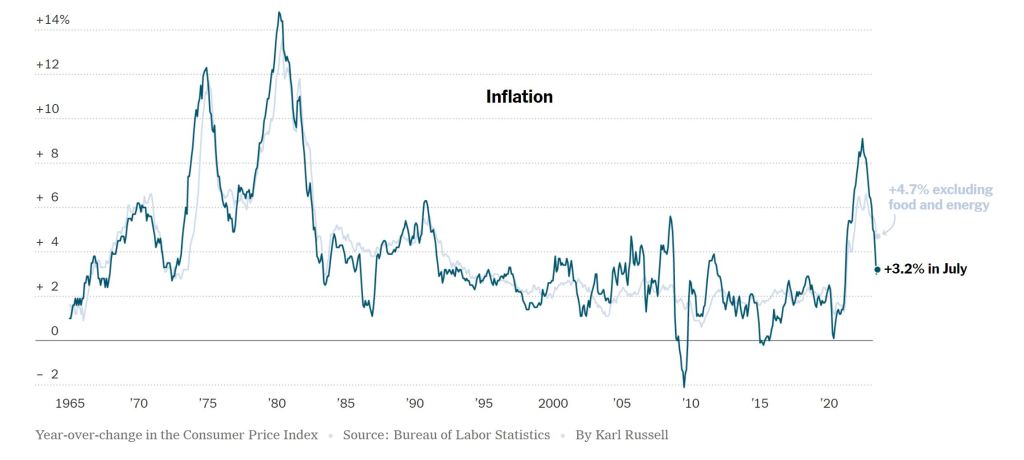
Inflation data in and just a bit cooler than expected.
The CPI – Consumer Price Index for July is out. Overall inflation increased by 0.2% lower than expectation of 3.2%.
The Core rate, which takes out food and energy prices also increased by 0.2%, again inline with estimates. Shelter costs rose but slowing down.
Initial Jobless Claims rose 21,000 to 248,000 but the Continuing Claims dropped 8,000 to 1.68M.
Rates are taking this with a grain of salt as we wait for more data this week and for the Feds September meeting.
-
ZipRecruiter Slowdown in Hiring and Fed Speak.
We are getting conflicting data from the San Francisco and Cleveland Fed.
The SF Fed wrote an article on shelter costs which is the biggest component to CPI inflation report. They anticipate a big decline in Shelter costs this year from 7.8% down to 5% by November. Their projections are to go negative by May 2024.
The Cleveland Fed is forecasting inflation will increase by 0.4% in July which is an increase from 3%. The forecast for July is even higher at 4.1%. This part is not good for interest rates.
These numbers are based on a year over Year comparison so it’s a bit tricky teasing out the correct data.
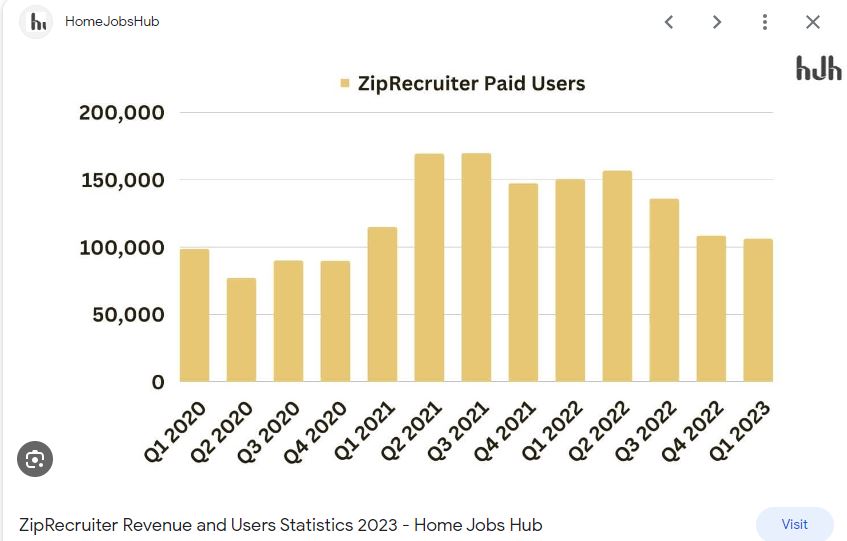
ZipRecruiter is showing a slowdown in opening and willingness to hire. This is the third quarter in a row suggesting a big slowdown in the job market.
-
Philly FED said all good ease up, but Fed Gov wants more hikes.
Philly Fed President Patrick Harker spoke this morning and stated or suggested that the Fed can now be patient and hold rate hikes later this year.
His comments are the exact opposite of Fed Governor Michelle Bowman, who wants more hikes.
Here is the Kicker… The difference is Bowman was a lawyer with no financial or economic background, while Harker is a PHD in Economics.
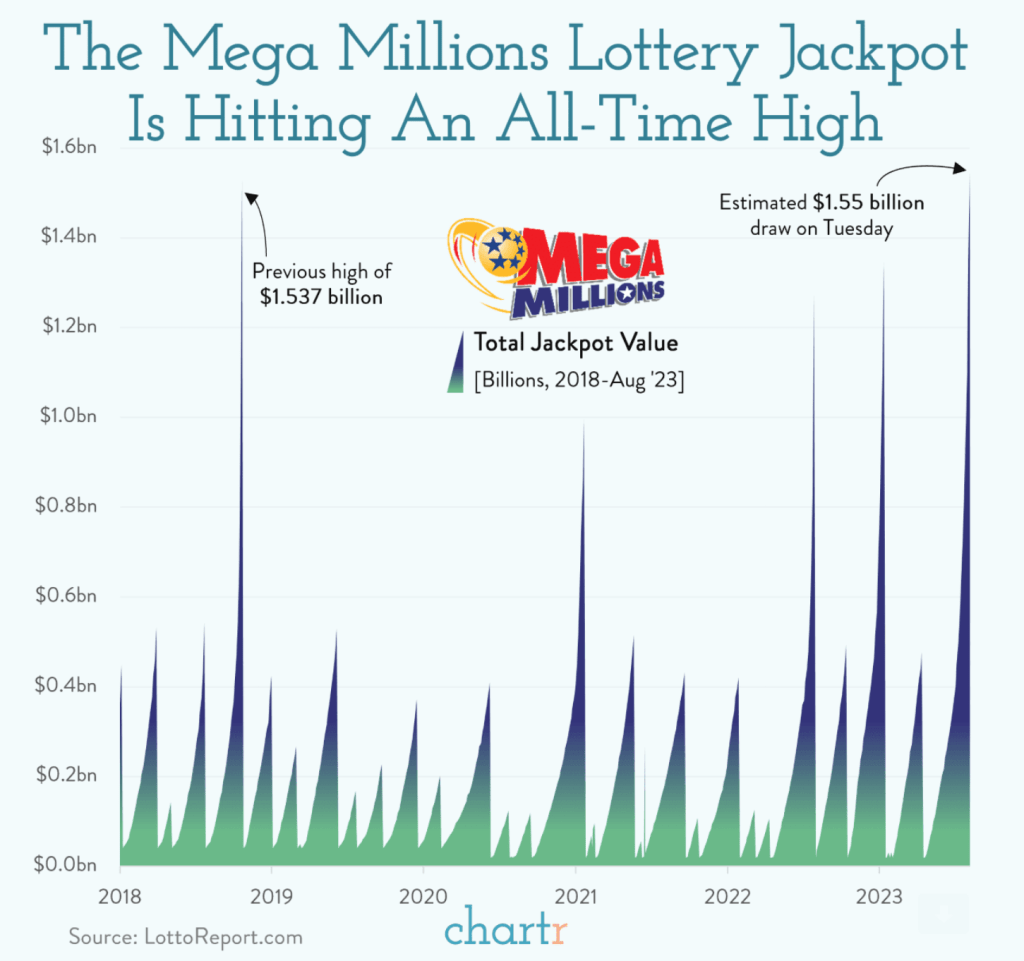
Did you buy your lottery ticket yet?
-
What does Inflation have to do with Unemployment, Hint, Everything.
As we wait with anxious breath for the CPI and PPI inflation numbers later this week, I ran across the below graph.
I find it absolutely fascinating the correlation between these two data points. Is inflation causing unemployment or the other way around? From a consumer’s perspective it sure seems like manufacturers raise prices to offset or compensate for dipping sales due to the lack of demand from the unemployed.
But this goes against high school economics 101; supply and demand.
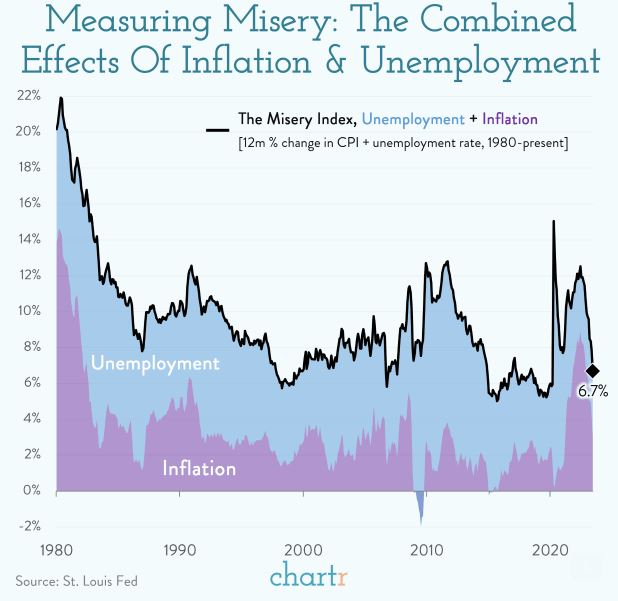
This graph is called the Measure of Misery or the Misery Index. Right now it stands at 6.7%, not too miserable compared to the average of 9.5% from 1980 to 2023.
Have a fantastic week and always here to help.
-
Subscribe
Subscribed
Have a WordPress.com account? Log in now.

