-
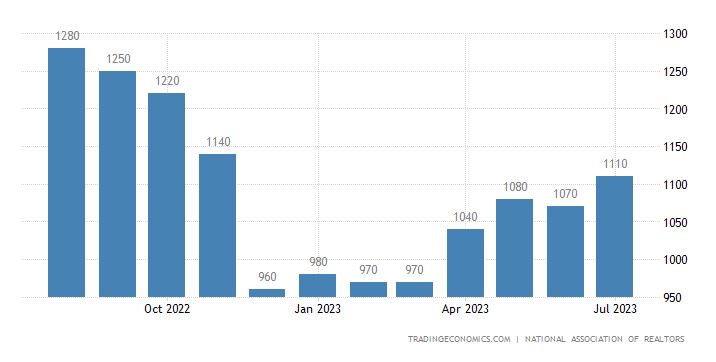
Housing Inventory increased 3.5%
Realtor.com’s August Report shows an increase in listing by 3.5% and only down 7.5% year over year.
Remember we were seeing 20 to 25% declines over the previous five reports.
This is going to be a FED heavy news cycle this week. Fed Governor Chris Walker has provided an even handed look opposed to the Hawkish commentary. We may be at the peak for fed hikes.
Later this week a slew of Fed Presidents in their respective reasons will be talking this week.
Have a great rest of your week and always feel free to reach out.
-
“Watch the Dog, not its Tail, to find out where it’s going”
Labor data came out and the initial numbers look like we are still adding more and more jobs and not retracting. 187,000 jobs created in July, slightly higher than the 170,000 estimate.
The issue is the revisions that come out for the previous months. As an example June was revised lower from 185,000 to 105,000. Same with July from 187,000 to 157,000.
The 3-month payroll average is now 150,000 vs the 6 months average of 194,000. Watch the dog, not it’s tail, to find out where it’s going.
New HELOC program 5 minutes to apply 30 seconds to get an answer. See video below.
Have a great Labor Day Weekend.
-
ADP Data is in and it was Normal.
I use the word Normal because that is what we want. Back to normal jobs reports post pandemic.
The August ADP Employment report showed 177,000 jobs created, which was weaker than the 200,000 expected. But July was revised higher from 324,000 to 371,000.
Job Stayers saw their annual pay increase 5.9% down from 6.2% and Job Changers saw an average increase of 9.5% but this was down from 10.2%.
You can kind of read the tea leaves with this report. Employers want to hold onto their employees and those same employees are not receiving as much benefit but switching employers.
There is a weakness in the labor market as large companies like Adidas, Adobe, IBM and Salesforce are “quiet cutting” their employees. This means reassigning workers with lower pay and lower title so they can trim costs.
It’s a strong indication we are getting back to normal and all the post pandemic hiring is subsiding.
I was fortunate to be a contributing writer for Mia Taylor for the BankRate article below. Enjoy.

-
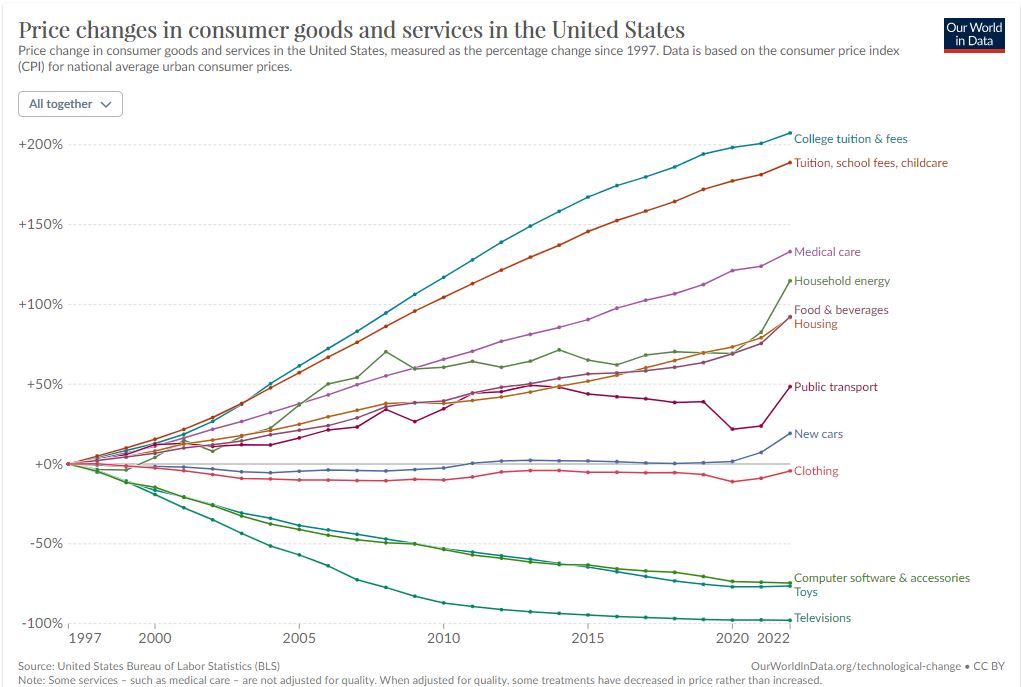
Largely Inaccurate but Dangerous in Volume
I have been saving the below graph for a few months now. As I head to CE training, continuing education all day today, I wanted to share.
I have heard and read countless experts talk about inflation, rates, housing market, you name it there is an opinion. If enough people say it or the news presents it, it has a way of creating its own life.
The rates will go down, the housing marking will not crash and inventory will bounce back. Stop building a bomb shelter and get out there and live a little.

Always feel free to reach out anytime. Lunch break at noon pacific time.
-
Let’s look at the Raw Numbers
What the Feds look at and how they’ve been behaving.
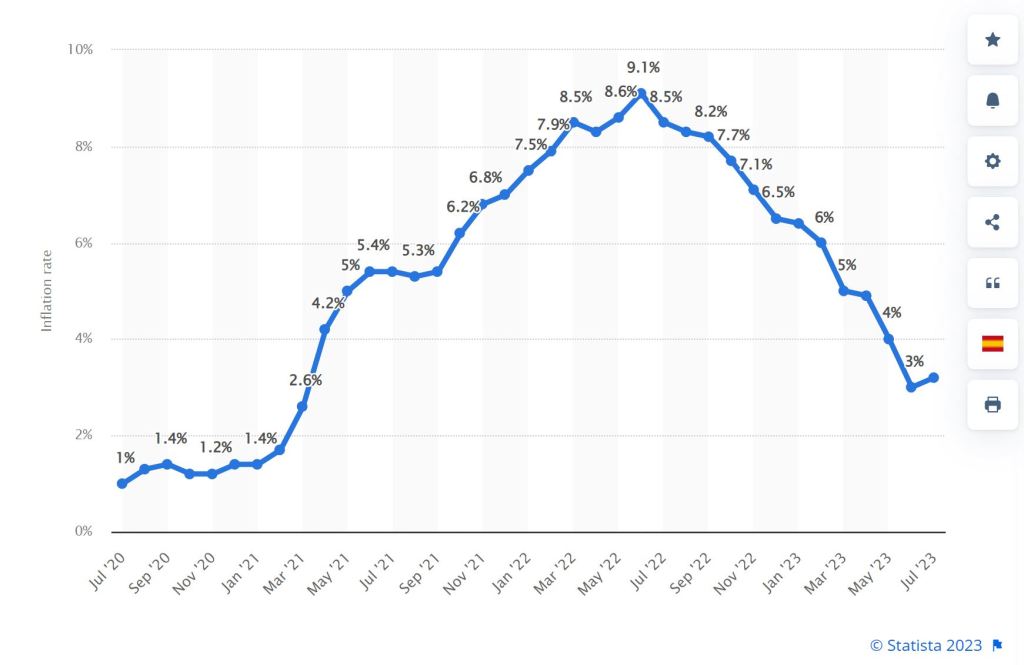
CPI Consumer Price Index down from 9% to 3.2%. Core CPI 6.6% to 4.7%.
Inflation June 2022 9.1% today 3.2%
Shelter costs rose 7.9% in the last year.
Median Home price 2019 $322K today $458k
Housing inventory average 1982-2023 2.3M April 2023 1M.
We are well on our way to lower Fed Rates, Lower interest rates and with that more inventory as the Pain to Sell wanes.
Its Monday almost the end of August already. Someday we will look back at 2023 and say whew got through that year.
-
It’s a 2% Inflation goal so quit asking me – Jerome Powell-summary
Fed Chair Jerome Powell spoke this morning at the annual Jackson Hole Symposium. There are two positions, one is Hawk and the other is Dove. The Hawk is still in the air.
There have been 11 rate hikes pushing the Federal Funds rate to a range of 5.25%-5.5%. Highest in 22 years. Coincidentally the mortgage rates are also at a 22 year high.
Hang in there; this too shall pass. Next week is the big inflation and jobs report.
Have a fantastic weekend, I think I’m going to gold this afternoon and try to get the Feds out of my head.
-
Birth and Death Model and the pandemic
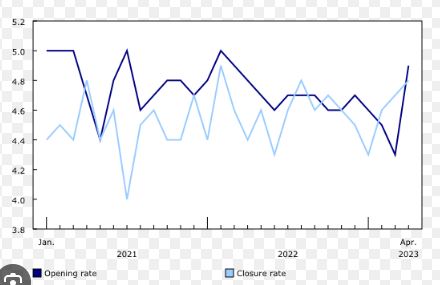
Now that I have your attention. The Birth and Death Model is a traditional workforce health indicator where Birth is the start of a company and Death is the closing of a company. The pandemic saw fewer close business compared to openings.
There is correlation between the two. This is an average of all company types so the percentage can vary from no change in the utility companies to leisure and hospitality which saw an decrease in business starts in January of a negative 16% to a positive 80% this July. Construction varies dramatically throughout the year swinging from a negative 44% in January to a positive 11% in July.
The forecast model predicts a negative Birth to Death Model indicating slower job growth i.e. Fed’s work has done its job.
We are eagerly anticipating Jerome Powell Fed Chair comments on inflation tomorrow.
-
If it Bleeds it Leads – Stop reading headlines
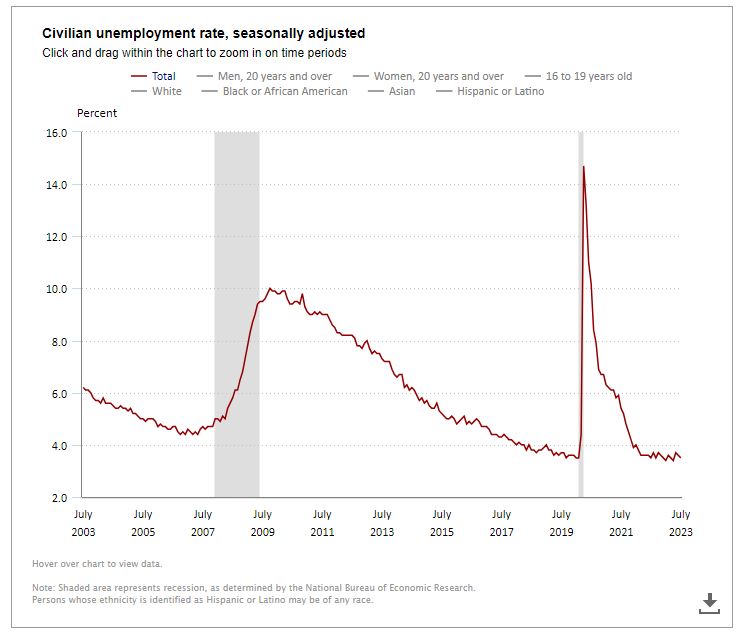
There is an interesting artifact in the jobs market, specifically the BLS The Bureau of Labor Statistics. Job numbers are released and then revised the following two months. This is typical and always happens.
The initial report overstated the job gains by 300k from April 2022 to March 2023. 25,000 per month or almost 9%. The market does not react to it because it’s in the past. That initial headline ruled the day; details matter and sometimes it takes two months to be correct.
If the September 1st jobs report is weaker as expected the Feds should stop the hikes.
New home sales are in demand and the builders are selling air. Of the 437,000 new homes for sale 164,000 were not even started.
I can feel the winds a turning… be ready for it and get pre-qualified and keep saving money for your down payment.
-
Please Jackson Hole Meeting help a brother out…
Rates are seeing their highest levels in over 20 years. We expect this to change favorably after the Central Bankers meet in Jackson Hole. We will also hear from Powell on Friday.
What we don’t want the Feds to be is hawkish.
Tom Barkin, the Richmond Fed President, spoke earlier this morning and said the Feds need to stick to their 2% target for credibility. The Feds need to see a weaker labor market before they stop for good or at least for a while.
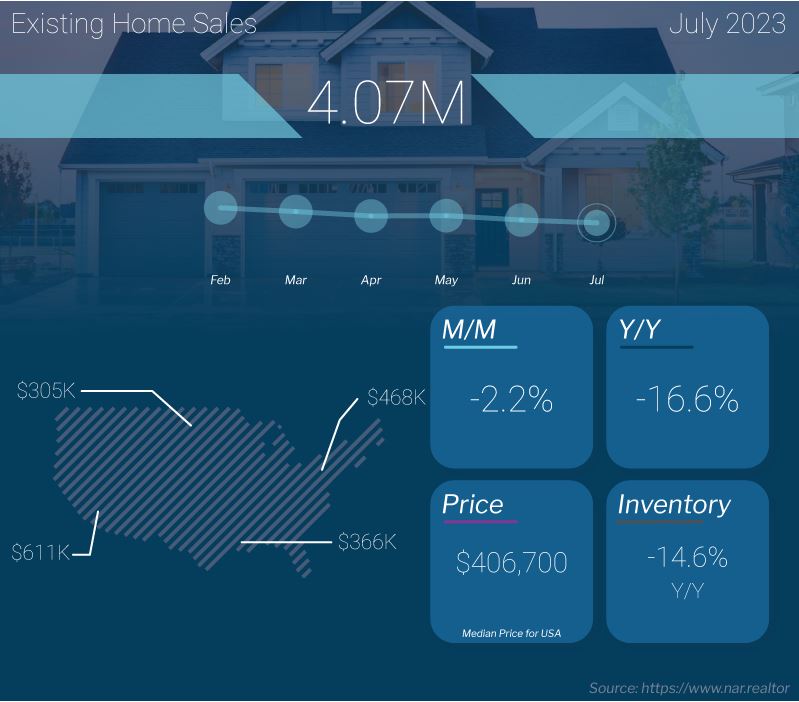
Existing Home Sales, which measures closings on existing homes, showed sales fell 2.2% in July. Sales are down 16.6% Y/Y.
Inventory is half that of 2019. 74% of homes sold in less than 30 days.
-
Pigs have been flying around for the last two years…..
Let’s try to wrap our heads around Bonds. They are the vehicle that drives the interest rate for Home Mortgages, specifically 10y Bond.
What is the difference between Bond Yield and the Bond Price.
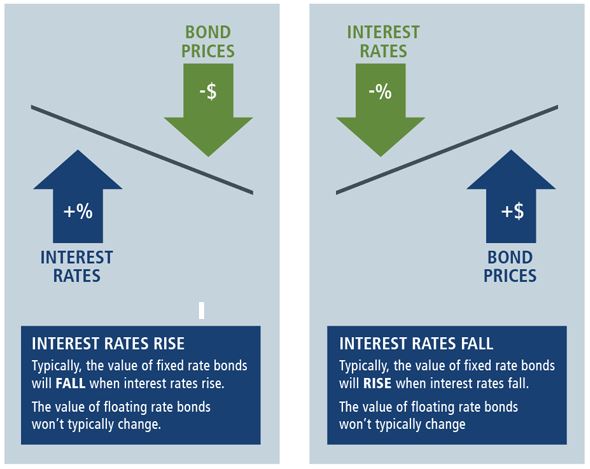
If you buy a $1000 bond at the issuance date, the bond price is the face value of the bond. The Yield will match the coupon rate of the bond. All good and if you have a 1% interest rate for a 10y bond, that is what you will be paid out until the maturity date when you get your initial purchase back.
Let’s imagine you buy the same bond but six months later. The new public offering or issuance date is now 2% interest. How does this affect your Bond locked in at 1%?
If you never plan to sell, it does not matter. You locked in your yield.
If you plan to sell, your new Yield is now based for this example on a lesser valued Bond. That old bond may trade at $980 which then translates to a lower yield over time.
What we are seeing in the market is a huge Shorting of the Bond market. The current short interest in 10-year Treasuries (bonds) rose over $800 Billion up 20% just in the last month.
“For the last few decades, if you asked when shorting bonds would be the trade of the year, you might get the classic response: when pigs fly,” she wrote. “I guess we can say that pigs have been flying around in 2022.”
What this all means is we anticipate rates dropping this summer.
-
Subscribe
Subscribed
Have a WordPress.com account? Log in now.

