-
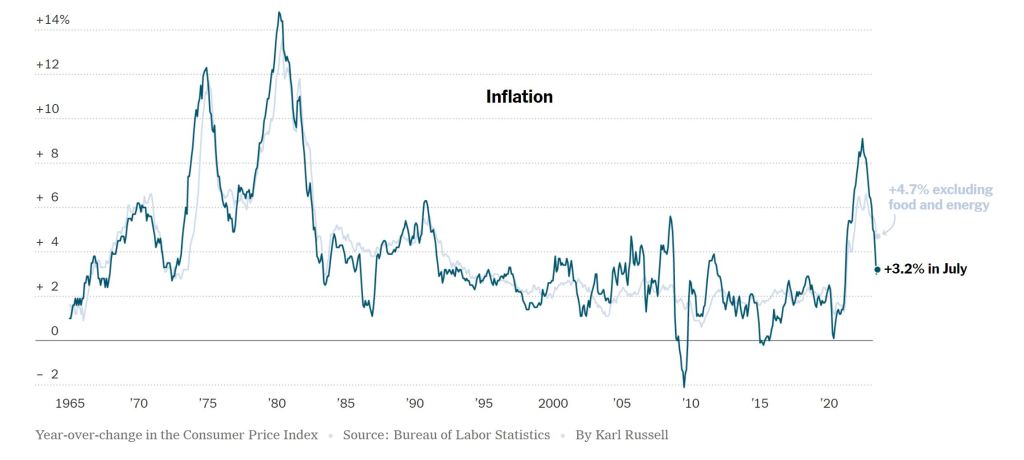
Inflation data in and just a bit cooler than expected.
The CPI – Consumer Price Index for July is out. Overall inflation increased by 0.2% lower than expectation of 3.2%.
The Core rate, which takes out food and energy prices also increased by 0.2%, again inline with estimates. Shelter costs rose but slowing down.
Initial Jobless Claims rose 21,000 to 248,000 but the Continuing Claims dropped 8,000 to 1.68M.
Rates are taking this with a grain of salt as we wait for more data this week and for the Feds September meeting.
-
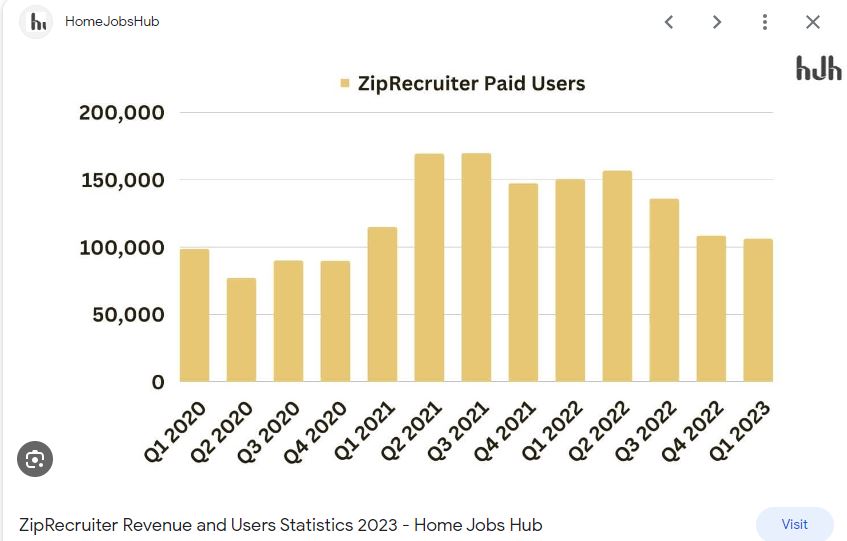
ZipRecruiter Slowdown in Hiring and Fed Speak.
We are getting conflicting data from the San Francisco and Cleveland Fed.
The SF Fed wrote an article on shelter costs which is the biggest component to CPI inflation report. They anticipate a big decline in Shelter costs this year from 7.8% down to 5% by November. Their projections are to go negative by May 2024.
The Cleveland Fed is forecasting inflation will increase by 0.4% in July which is an increase from 3%. The forecast for July is even higher at 4.1%. This part is not good for interest rates.
These numbers are based on a year over Year comparison so it’s a bit tricky teasing out the correct data.
ZipRecruiter is showing a slowdown in opening and willingness to hire. This is the third quarter in a row suggesting a big slowdown in the job market.
-
Philly FED said all good ease up, but Fed Gov wants more hikes.
Philly Fed President Patrick Harker spoke this morning and stated or suggested that the Fed can now be patient and hold rate hikes later this year.
His comments are the exact opposite of Fed Governor Michelle Bowman, who wants more hikes.
Here is the Kicker… The difference is Bowman was a lawyer with no financial or economic background, while Harker is a PHD in Economics.
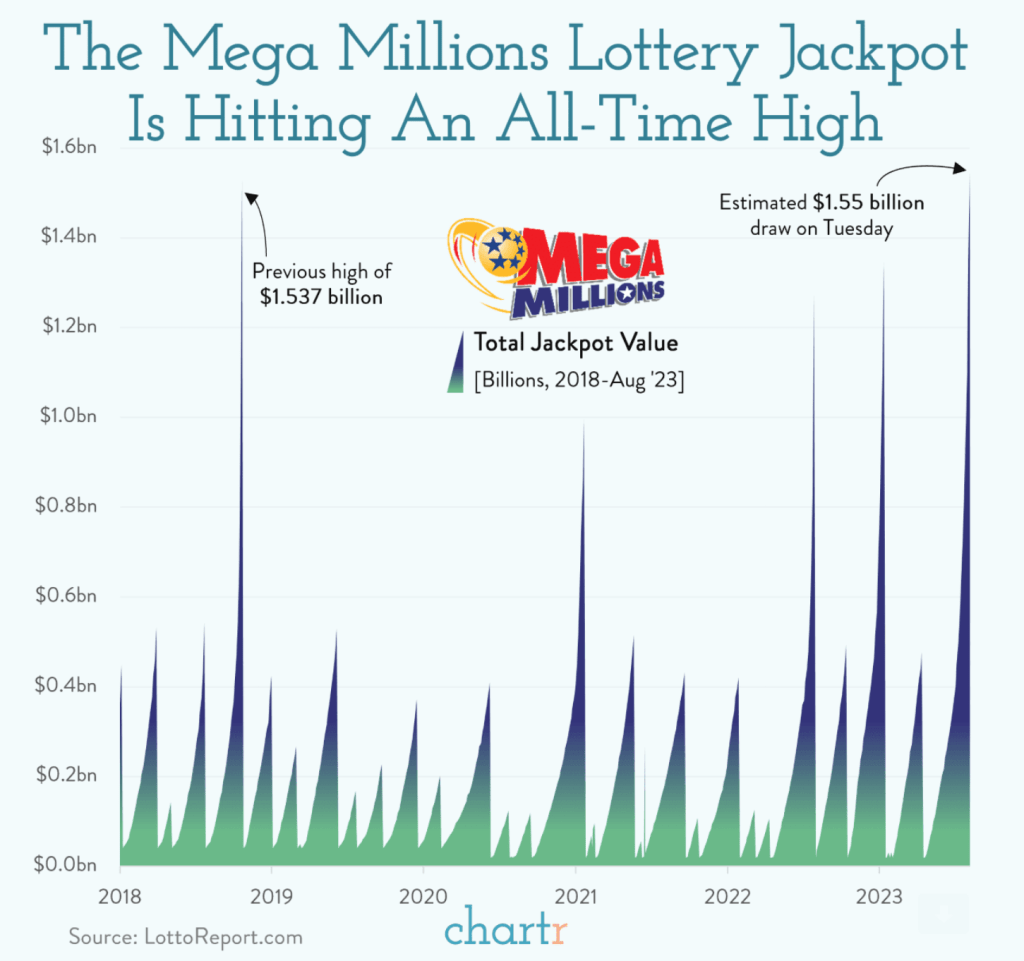
Did you buy your lottery ticket yet?
-
What does Inflation have to do with Unemployment, Hint, Everything.
As we wait with anxious breath for the CPI and PPI inflation numbers later this week, I ran across the below graph.
I find it absolutely fascinating the correlation between these two data points. Is inflation causing unemployment or the other way around? From a consumer’s perspective it sure seems like manufacturers raise prices to offset or compensate for dipping sales due to the lack of demand from the unemployed.
But this goes against high school economics 101; supply and demand.
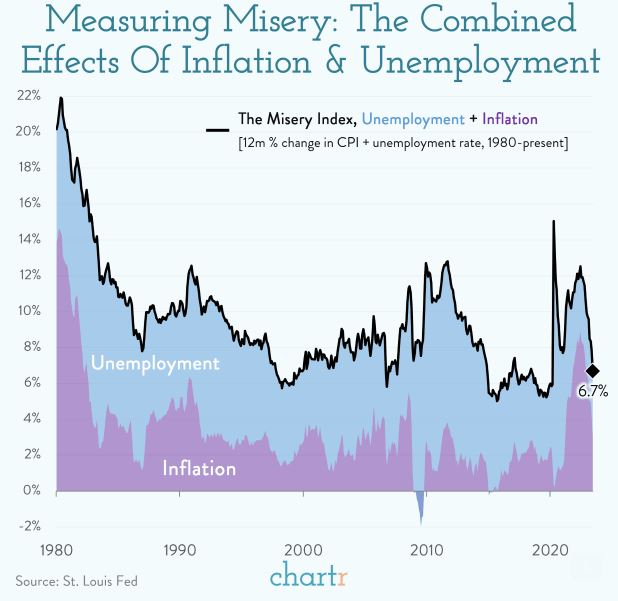
This graph is called the Measure of Misery or the Misery Index. Right now it stands at 6.7%, not too miserable compared to the average of 9.5% from 1980 to 2023.
Have a fantastic week and always here to help.
-
Soft landing is far better than a Hard fall.
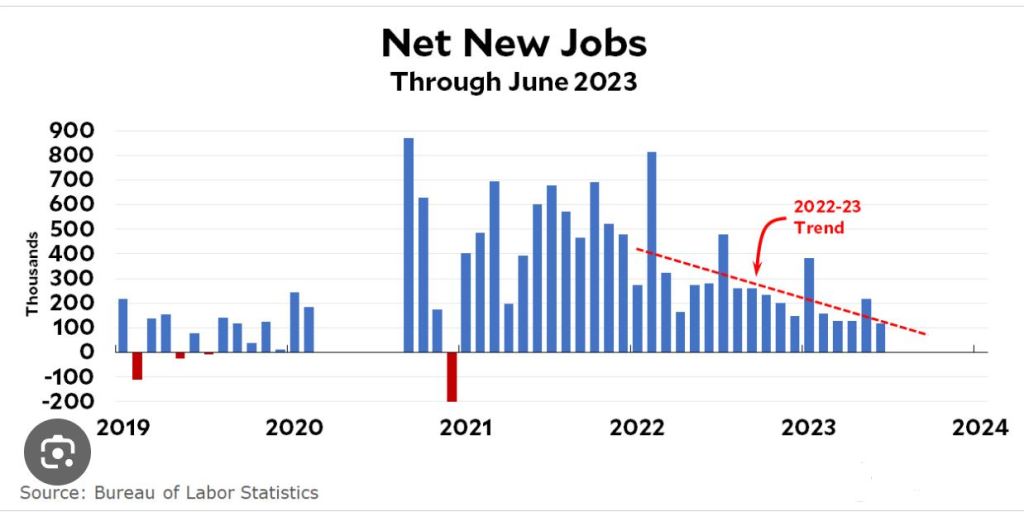
The Bureau of Labor and Statistics (BLS) reported 187,000 Jobs created in July. The estimate was 200,000. June numbers were also revised lower from 209,000 to 185,000.
We are looking at the trend line. This is what a soft landing looks like.
Ran across this graph the other day and thought it was interesting given a new Nuclear Power Plant just went online last month in the state of Georgia. First reactor in the USA since 2016.

-
What a difference a Day Makes, we hope.
Jobs report coming out tomorrow. Been a tough week for rates. I am going to make this short as I am taking a in person test updating my National Mortgage credentials for TX and AZ license.
I will update in the Morning.
-
Should I stay or Should I go now….
Annual pay for job stayers increased 6.2% year over year, but job changers saw an average increase of 10.2%.
ADP the payroll company Employment report for July, showing 324,000 jobs created. The estimate was 190,000.
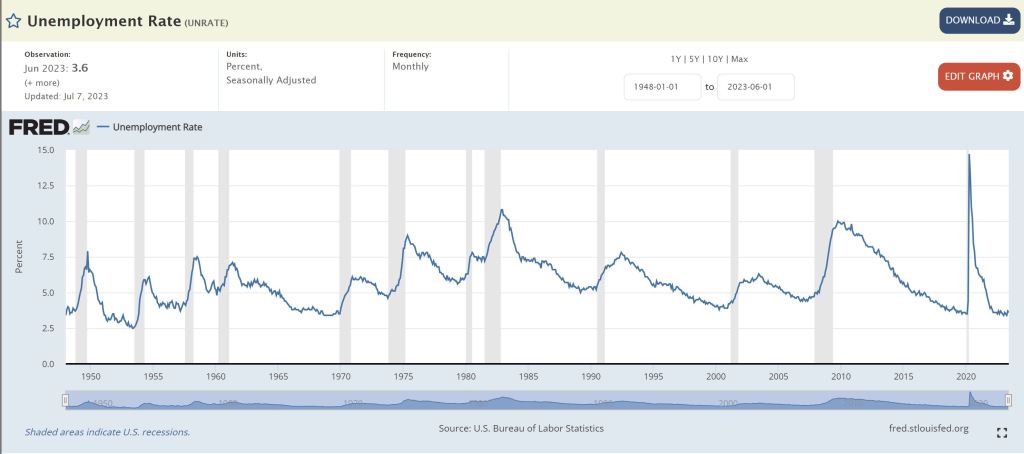
There are many more stats I could write or sum it up. Economy is strong, unemployment is low but a clear trend of fewer openings on the horizon.
The real data comes out Friday. Stay tuned. Below is the Unemployment rate going back to 1948.
-
Watch where the Dog is Walking not how his tail is wagging
If we look too closely at anything we focus on the wrong cue. The first thing I do in the morning is check rates. Am I going to have a good or bad day?
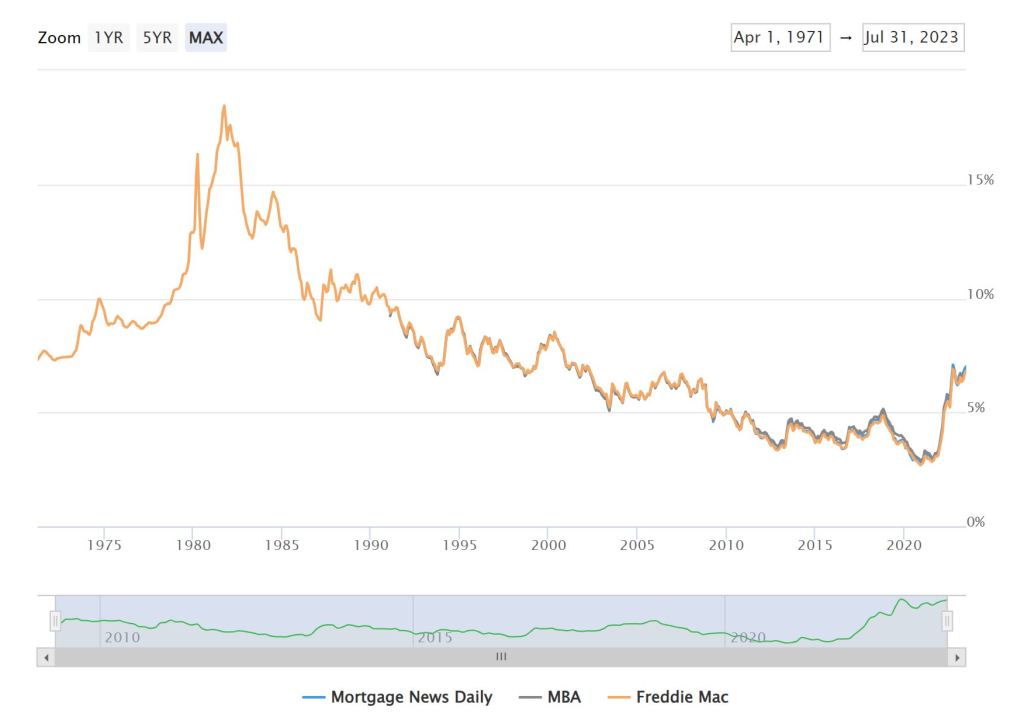
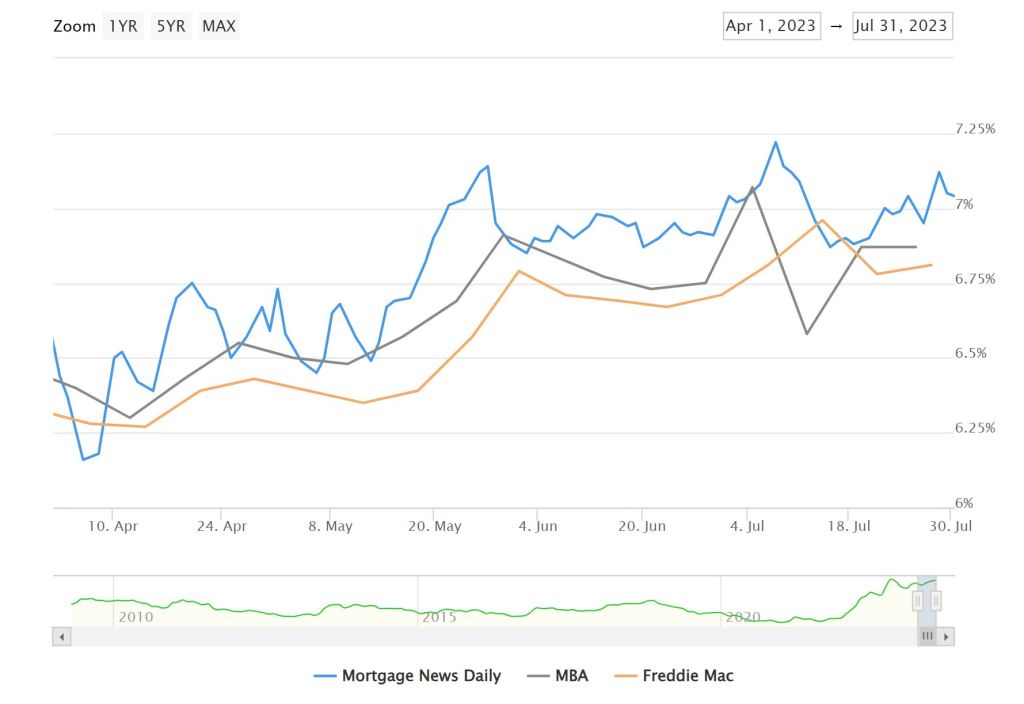
Take a look at the two graphs below. The first is a 50+ year view, while second graph covers three months. We all want the rates to go back to sub 3%, but the likelihood is next to zero.
In the long term, rates in the 6’s and even the 7’s are normal, and in some cases, low. We hope to see rates come down closer to the 5’s or high 4’s, if only to shake loose the 3-percenters (coined a new word) and encourage them to get back in the market and sell their homes.
-
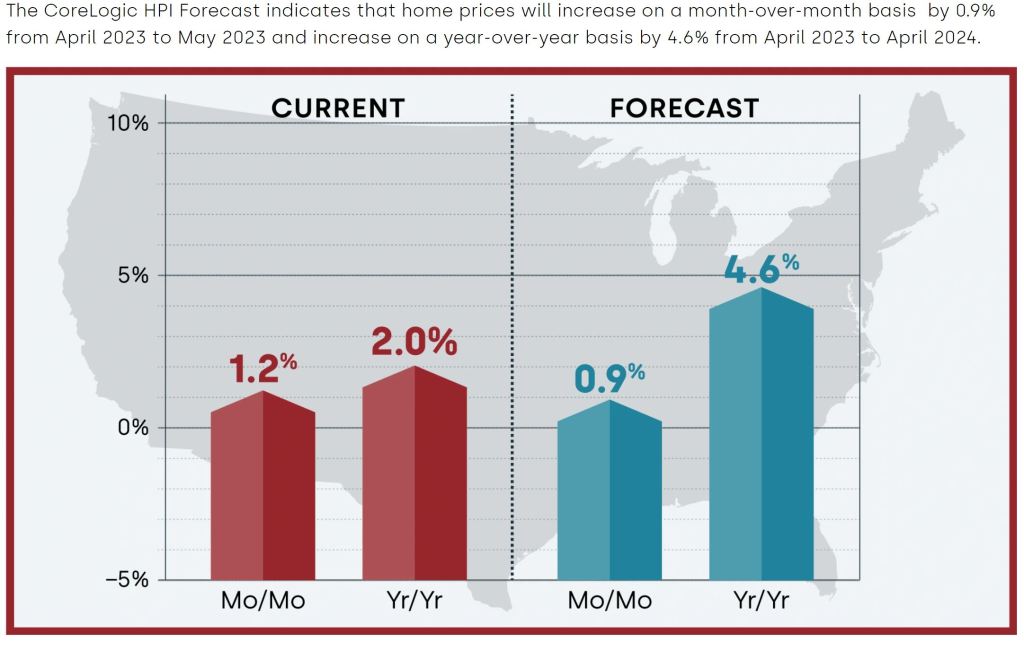
Non-insignificant Impact and Home values projected 10% appreciation.
Home Value Projection: Given the current 4.8% increase in home values this year, it is reasonable to extrapolate that home values are on track to appreciate by 10% over the remaining year.
Yellow – Freight Services, a carrier specializing in pallet-sized shipments, made a significant decision over the weekend by terminating 30,000 employees and shutting down its operations.
The Federal Reserve’s aggressive approach to rate hikes has been concerning, as it seems to disregard the toll it’s taking on real businesses. Yellow failed to reorganize and refinance over $1B of debt due to much higher rates. This may be the canary in the coal mine.
This week is all about Jobs. Opening, jobless claims and job cuts. Stay tuned.
-
PCE Personal Consumption Expenditures Down from 3.8% to 3.0%
Inflation rose 0.2% in June as expected. the Y/Y index decreased from 3.8% to 3.0%. The peak last year was 7.0%. We are moving in the right direction.
Next week is all about Jobs, Manufacturing and Services reports.
Leaving you with the below. Have a great weekend.
-
Subscribe
Subscribed
Already have a WordPress.com account? Log in now.
