-
Leading Economic Index (LEI) Says recession ahead- here’s why.
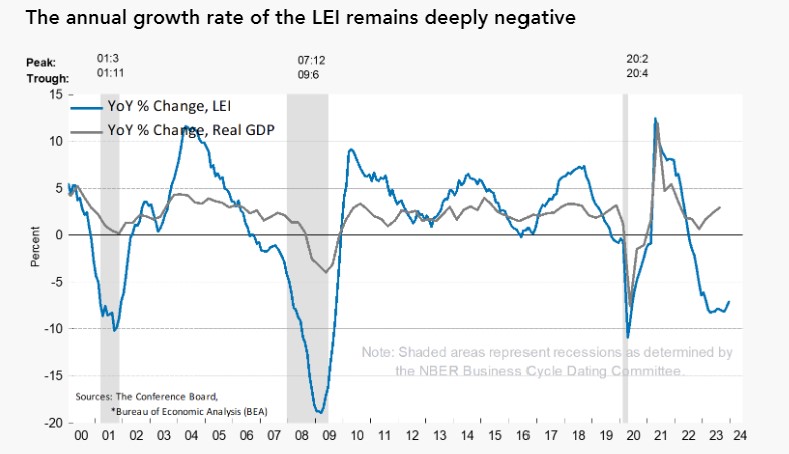
LEI, or the Leading Economic Index, serves as a comprehensive indicator aiming to anticipate the global economic trajectory. It assesses various data sets, including the yield curve in the bond market, durable goods orders, the stock market, manufacturing orders, building permits, and the Producer Price Index (PPI).
Imagine it as a panoramic view of everything happening worldwide, all considered simultaneously. Remarkably, this marks the 21st consecutive month of negative readings.
The Conference Board, the entity behind the LEI release, is indicating a potential negative GDP growth in Q2, with expectations of recovery in Q3 of 2024.
In my perspective, this might explain why, despite low employment and decreasing inflation, there’s a pervasive sense of unease about the economy. The overall trend suggests a gradual slowdown, not rapid but noticeable.
-
What’s the Rate? Depends on who you ask.
One of the most common questions I get asked is, “what is your rate”.
I could then spend the next hour explaining the nuances of what goes into answering that question including credit score, down payment, loan program, conventional, FHA, VA or Jumbo loan, but I will spare you.
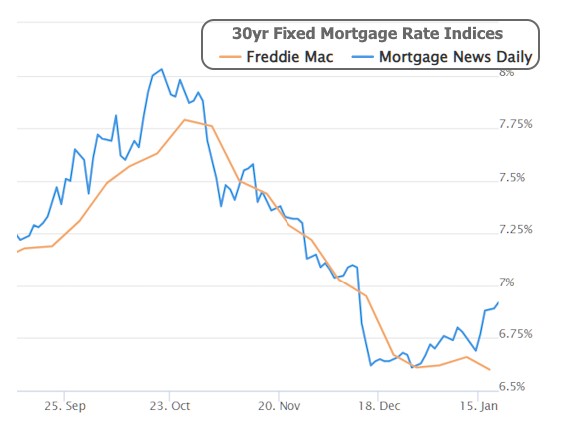
If you just listen to the news or google current rates, it’s all over the place. Mortgage Rates are unique to your specific situation. Call us to get an accurate number and take the news media with a grain of salt. They are usually a week late to the party.
Even though there is a disparity between Freddie Mac and Mortgage News Daily surveys they both show the downward trend.
Personal Consumption Expenditures come out Friday and are expected to be good news for the bond market.
-
What is Consumer Sentiment and does it matter?
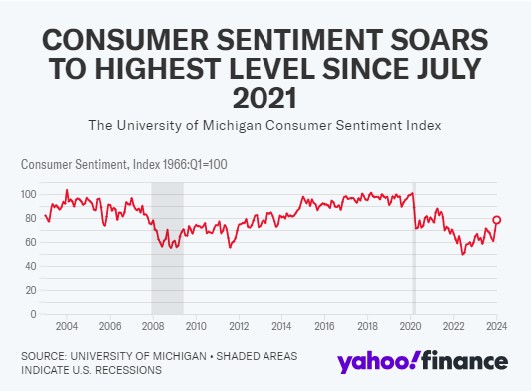
The index reading for the month came in at 78.8, its highest mark since July 2021, and well above economist expectations for a reading of 70.1. The cumulative 29% climb in the sentiment index over the past two months is the largest two-month increase since the US economy recovered from recession in 1991 – Yahoo Finance
If we look at the graph below we can see the large climb was due to a large drop from 2021-2022.
This is another indication we are headed back to a more normal stance as we look back over the last 20 years.
Rates are holding their own, home prices are up 4.4% Year over Year.
Consumer Sentiment is the consumers view by confidence that inflation has turned a corner and strengthening income expectations.
-
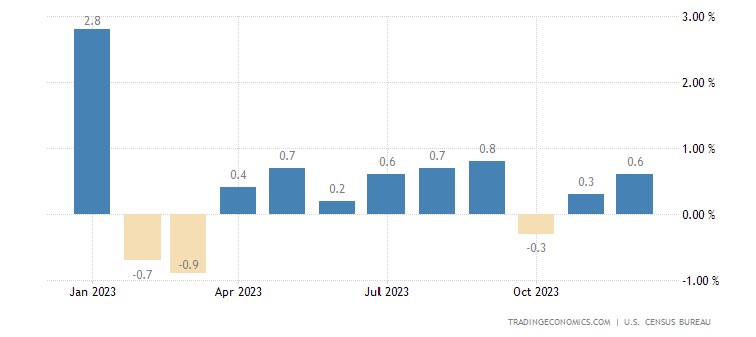
Retail Sales are up 0.6% vs 0.4% as expected, but what is really going on.
The bond market just flinched and I don’t know why. December’s data is seasonably adjusted but everything cost more this year compared to last year so of course the Retail Sales numbers are going to be higher.
We have a strong economy regardless of the naysayers.
The 10 yr yields ended the day slightly higher and we lost some of our rate gains this week.
I am headed to a sales meeting in LA so will be cutting this short.
-
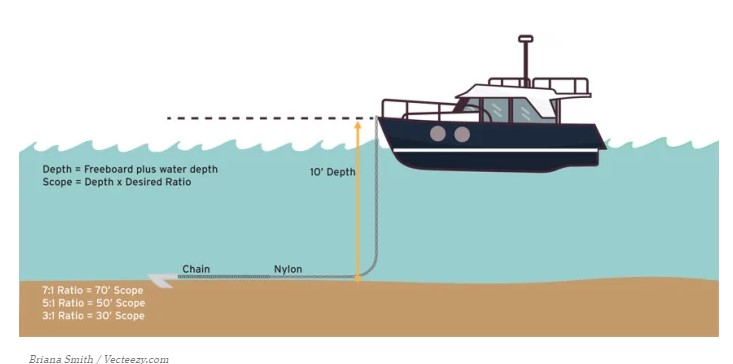
We need a lighter Anchor with better holding power. Our scope is off just a bit.
This is going to be a stretch, but its worth it. We have had rough seas the last two years and looking for sunlight and calm.
Inflation continues to normalize as Fed Governor Christopher Waller stated yesterday’s confidence the 2% inflation rate is on the horizon.
The challenge is determining whether this is the right time to anchor our boat. The water seems much calmer, but do we have enough chain? The chain is what ultimately holds the boat in place. Every 10 feet of depth requires 70 feet of chain.
In our scenario Chain represents the Inflation numbers, Unemployment rate and the continued data confirming we are actually in calm water and can stay in place.
The Feds believe we need more Chain (data). I can’t disagree with them but I think we are all ready to Anchor the boat.
-
Rents rising 2.7% but last year it was 7.5%
It’s important to understand what inflation measures. This may sound simple, but it is quite complicated.
We examine the price of a good or service today compared to last year. When there is a spike in pricing, such as the supply shortage generated by the pandemic and high demand, the comparison to the previous year’s costs becomes dramatic.
As prices settle and the supply line evens out, prices stabilize. Consumers become a bit more discerning, and retailers adjust.
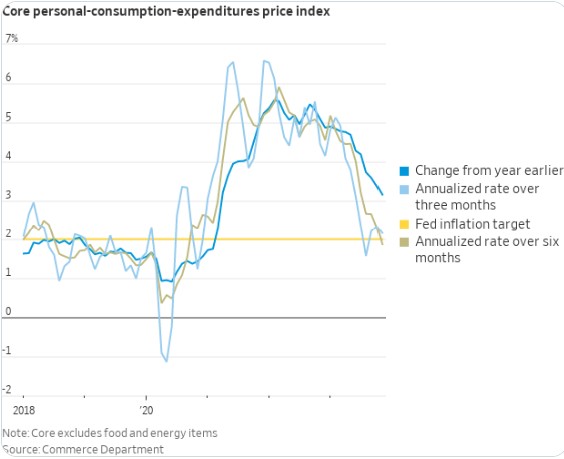
A better gauge of inflation might be a six-month perspective, which Fed Chair Powell prefers. Personal Consumption Expenditures (PCE) is currently 1.85% below its 2% target.
PCE measures the prices consumers pay for goods and services.
-
It’s getting Chilly, PPI numbers in and cooler than expected.
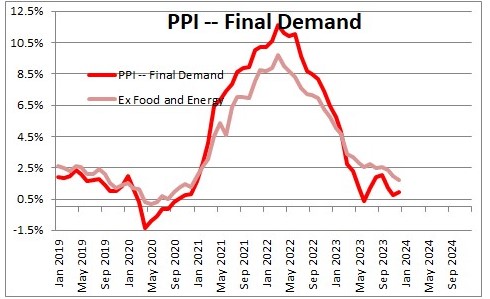
The Producer Price Index (PPI) report indicates a decrease in wholesale or producer inflation, contrary to market expectations. Here’s a breakdown of the key points:
- December PPI Movement:
- Actual: -0.1%
- Expected: +0.1%
- This means that prices at the wholesale level fell by 0.1% in December, against the market’s anticipation of a 0.1% increase.
- Year Over Year (YoY) Rise:
- Actual: +1%
- Expected: +1.3%
- The YoY rise is only 1%, falling short of the market’s expected 1.3% increase.
- Core Rate (Excluding Food and Energy Prices):
- Actual: 0%
- Expected: +0.2%
- The Core Rate, which excludes volatile items like food and energy, remained unchanged at 0%, while the market expected a 0.2% rise.
Implications:
- Lower inflation: The decline in producer prices suggests lower inflation, which can benefit consumers as cost savings may be passed on to them.
- Mortgage rates: Lower inflation often translates to lower mortgage rates, which could spur the housing market.
Future Outlook:
- The data might increase the likelihood of the Federal Reserve (FED) lowering interest rates in March. Lower inflation and the potential for economic stimulus are factors that could influence the FED’s decisions.
Conclusion: The PPI report indicates a trend of lower inflation, potentially leading to benefits for consumers and impacting financial markets. Keep an eye on how these trends evolve, especially with regard to FED decisions. Have a great weekend, and see you on Tuesday!
- December PPI Movement:
-
Deflation or Disinflation What’s the difference? CPI numbers in.
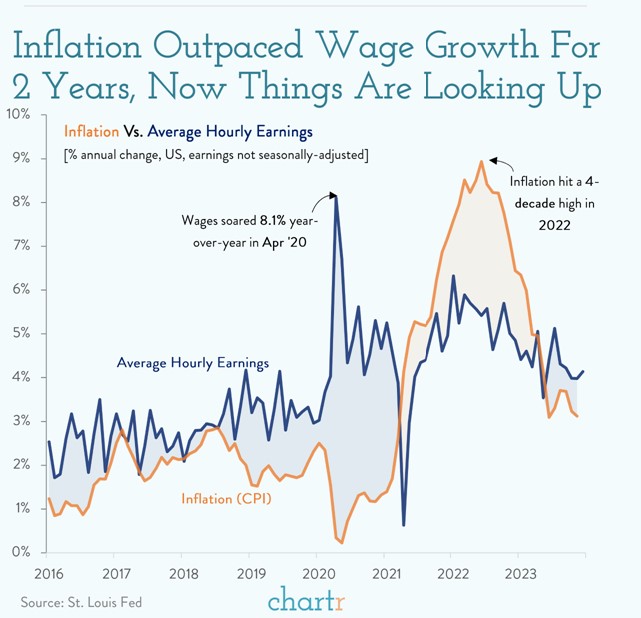
Consumer Price Index (CPI) numbers are in, with inflation rising by 0.3%, slightly higher than expected. We are now at 3.4%.
Taking a closer look, these are year-over-year comparisons, so as we move forward, the previous year’s inflation data comparison becomes tougher to surpass.
You may hear that the last mile is the toughest. The Fed wants a 2% inflation rate.
One reason consumers are dissatisfied, even though the unemployment rate is at historic lows, inflation has dropped significantly and new and used car sales have dropped over 37%, is because what you purchased a year ago is over 7% more expensive today.
If inflation were 0%, that loaf of bread would still cost 7% more than last year.
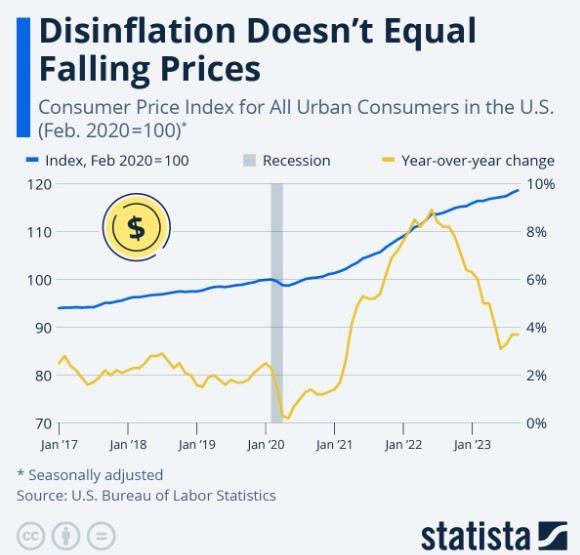
Disinflation is the slowing of inflation, which is what has happened over the past year.
Deflation occurs when the inflation rate is negative, and prices are falling.
We are in the Disinflation period not Deflation.
-
Refinance? Yes and the applications tell a larger story.
The Mortgage Bankers Association (MBA) measured a 19% volume increase from the previous week and up 30% from the same week a year ago. This is also true for Purchase applications but not quite as dramatic.
The buyers and sellers are coming out of the woodwork and testing the waters. When refinances are up, it’s a strong indication the Home Owners have noticed the rate drop.
The flood gates are going to open so be financially prepared and get pre-approved for a mortgage.


-
Inflation Data over the past six months Indicate…. -Fed Gov Bowman
What a difference a day makes. Fed Governor and voting member Michelle Bowman stated that the Fed’s actions are bringing down inflation.
Why this is important is that she was one of the more hawkish members, indicating two more rate hikes just last month.
Thursday is the day the CPI – Consumer Price Index inflation report comes out for the month of December. We may see a slight rise in inflation from 3.1% to 3.2% or it might remain flat.
The Core inflation, which strips out food and energy, is expected to drop, which the bond market will likely favor.
-
Subscribe
Subscribed
Have a WordPress.com account? Log in now.

