-
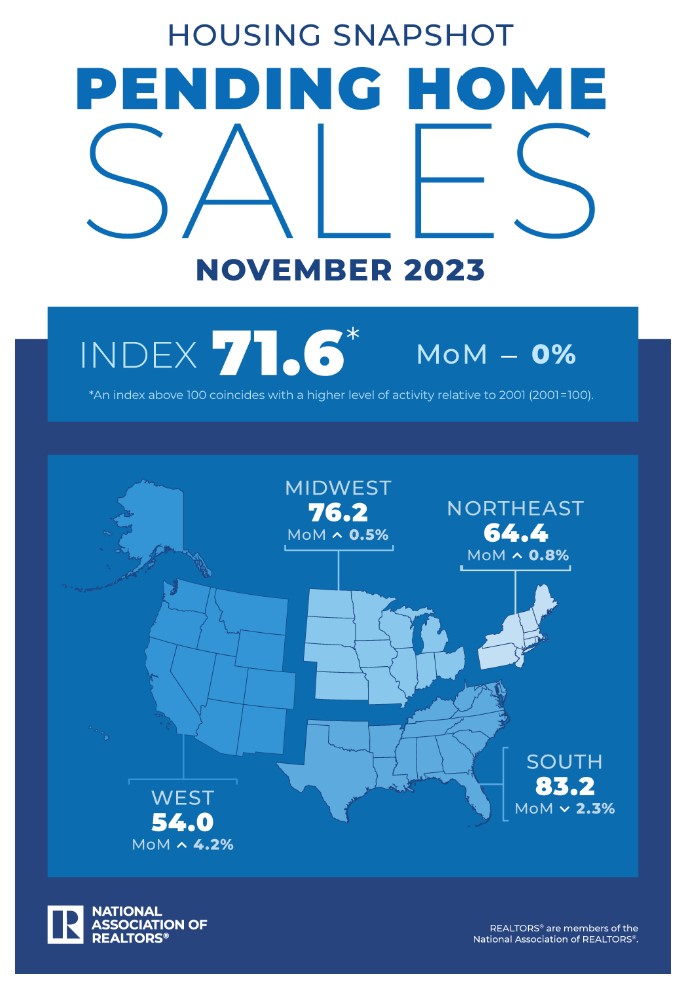
Pending Home Sales, what homes.
Pending Home Sales, which measure signed contracts on existing homes, not new construction, were flat last month, surprising the market that had expected a gain, especially with the lower rates. Inventory is still a major challenge.
December should tell a different story. More potential buyers are applying for loans, and more potential sellers are thinking that maybe it’s the right time to sell.
Initial Jobless Claims are flat, while Continuing Claims rose by 14,000 to 1.875 million, one of the highest readings since November 2021. This is indicative of a weaker labor market.
What this really means is the economy is slowing, which helps with inflation and causes mortgage rates to drop.
-
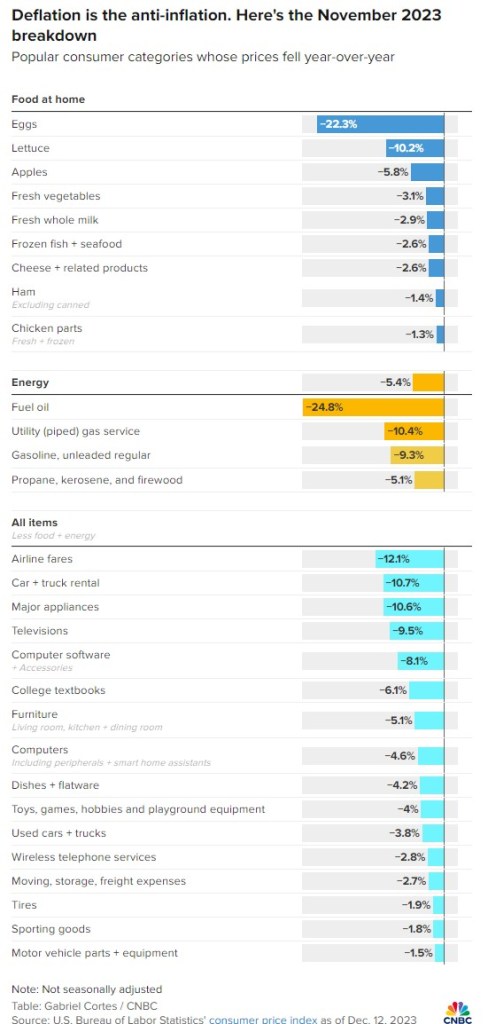
Deflation, there I said it.
What goes up must come down. As Michael Douglas said in Wall Street, ‘Greed is Good,’ until consumers wise up.
We still face a housing inventory problem, as I mentioned yesterday. Fannie Mae and Pulsenomics Survey released their Q4 Home Price Expectations Survey this morning.
Over 100 of the top housing experts in the country believe home prices will rise on average by 2.4% and by 25% over the next 5 years.
As we continue to see mortgage rates drop, sellers are starting to take notice. A 5% interest rate compared to a 3.5% rate is only a 15% difference in the house payment.
The 5% rate is not in our rearview mirror but up ahead. We don’t know how far, but it’s out there.
-
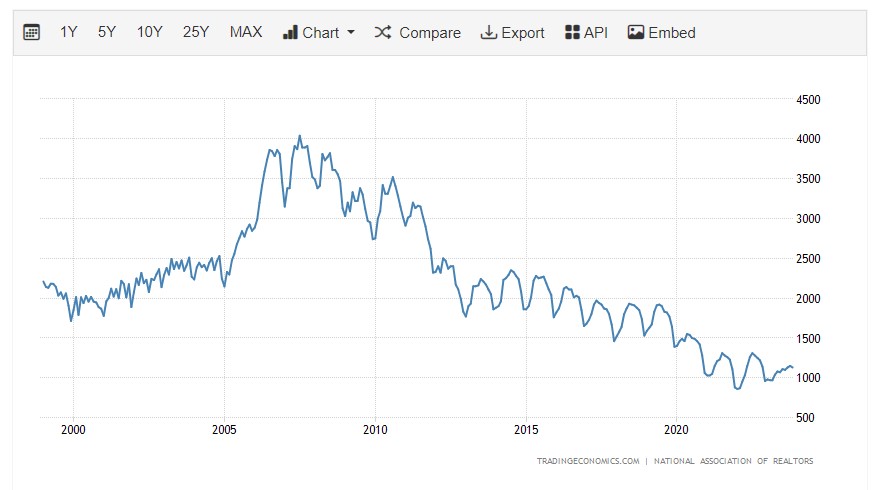
Its all about Inventory. The Rate drop is fueling demand.
Rates went up in 2023 but the home values continued to rise. Rates are now dropping but the home values continue to rise.
The demand is so high that it will take a larger drop in mortgage rates for the vast majority of homeowners to budge.
Until we have an appreciable rise in inventory, I would not be sitting on the sidelines waiting for home\ values to drop before you buy. This is not 2008 by any stretch.
In 2022 home appreciation hit 6%. This year we will end the year 6-8%.
-
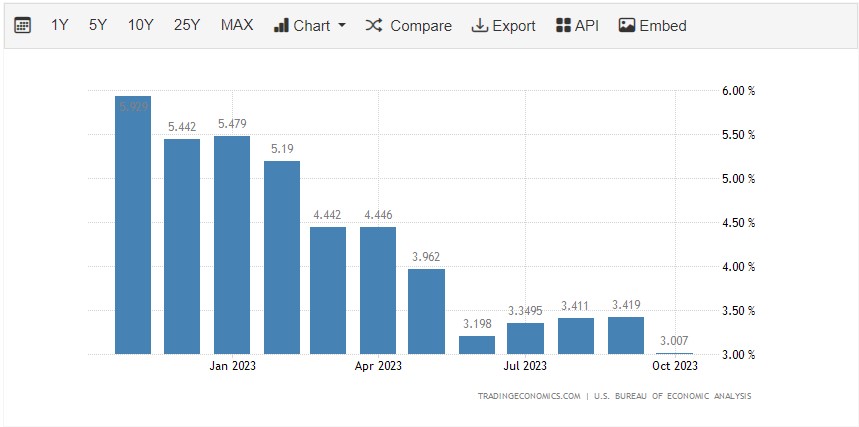
Inflation rate 2.6% below 2.9% estimates. And Thank you.
The Personal Consumption Expenditures (PCE) price index fell by 0.1% in November, putting the inflation rate at 2.6%, which is lower than the expected 2.9%.
The Core PCE, which excludes food and energy and provides a less volatile perspective and is the Fed’s preferred metric, decreased from 3.5% to 3.2%, below the expected 3.4%.
With all that said, the likelihood of the Fed cutting rates at their March 20th meeting is now 86%.
This is all good news and bodes well for continued relief with mortgage interest rates.
A personal thank you to everyone this year. These blogs and video blogs have been an integral part of my life, and I appreciate all the feedback and support.
Cheers and Happy Holidays, and here’s to 2024.

-
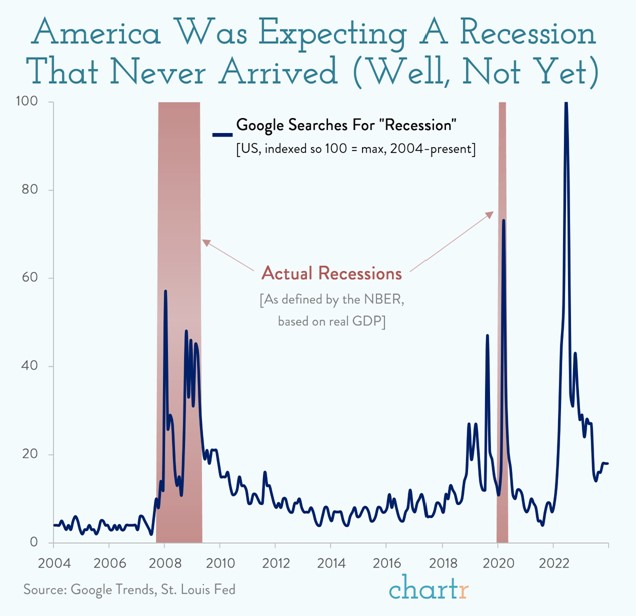
The Recession that wasn’t
It’s always interesting to see the raw data from Google search. We’ve been hearing about a recession for two years now, with experts initially predicting a hard landing, then a soft landing, and now, perhaps, no recession at all.
In 2022, 80% of Americans believed the country was either in a recession or would be in the following year, according to the Harvard CAOS/Harris Poll.
After steady growth throughout the year, the economy expanded by 4.9% in the last quarter of 2023, driven by the same consumers.
Just in, the Gross Domestic Product (GDP) increased by 4.9% on an annualized basis, slightly below the expected 5.2%.
Initial Jobless Claims reported 205,000, surpassing expectations of 215,000. Additionally, Continuing Claims decreased to 1.865 million from the estimated 1.888 million.
-
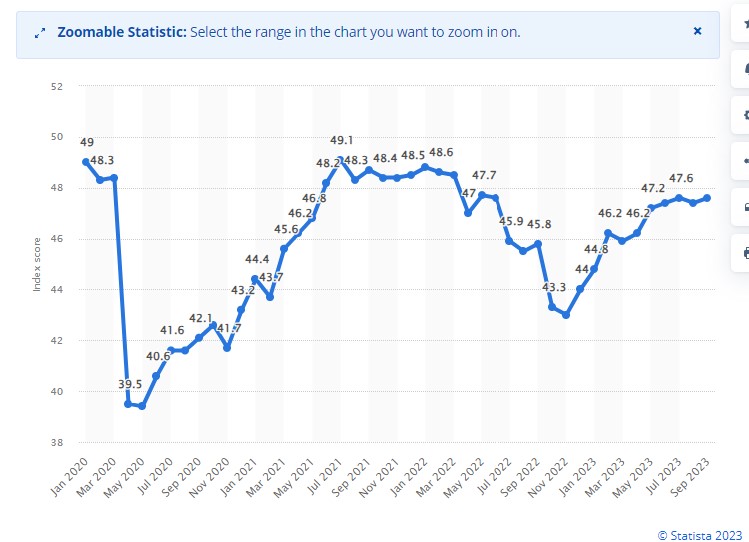
Consumer Confidence levels hit Highest level Since July.
Consumers between the ages of 35 and 54 exhibit the highest confidence. They believe that interest rates will fall and are more likely to consider purchasing a home.
While consumers have been on the sidelines, they are starting to move and feel encouraged about the future.
Application volume is up by 1.8%, but it is still down 18% from last year. Refinances have decreased, which I found interesting initially. However, upon reflection, it makes sense—why would you refinance when rates are dropping? It would be more prudent to wait for the landing before re-engaging.
2023 is almost in the rear view mirror.
-
Housing Starts & permits Up. Good news.
As more homes are completed, the pressure on the rental market persists. According to CoreLogic, rent prices have increased by 2.5%, though this is lower compared to the previous report.
Housing starts experienced a significant rise of almost 15% in November, reaching 1.56 million, marking a 4% increase year-over-year. Single-family permits also saw a 0.7% increase and are 23% higher compared to the previous year.
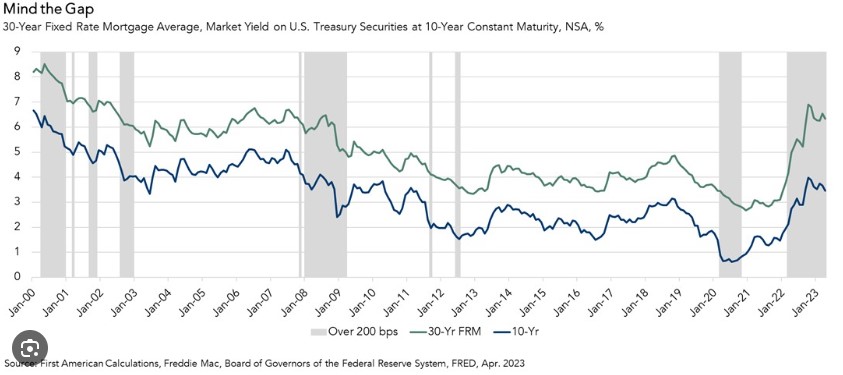
Interest rates have continued to show improvement over the last month, with hints of a possible decline in the coming months.
The Federal Reserve is discussing the possibility of three rate cuts in 2024, with the potential for four.
Interest rates, in general, are approximately 2 points higher than the current 10-year yield, which stands at 3.917 at the time of this blog. Despite this, the national average for a 30-year mortgage is 6.65. This indicates that there is room for rates to drop further, even if the 10-year yield remains steady.
-
I know its Monday but Friday is the Tell…
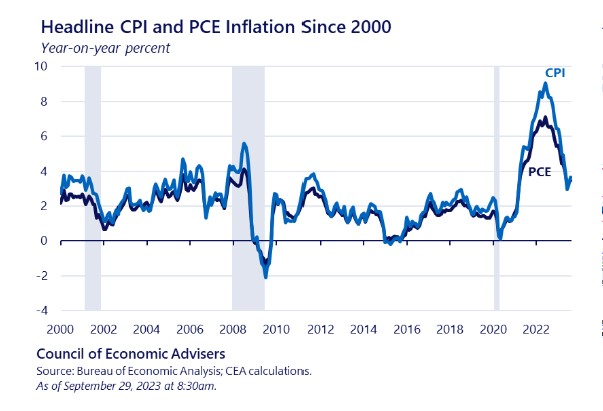
Personal Consumption Expenditures (PCE) measures all goods and services bought by U.S households. This is different from the Consumer Price Index (CPI). CPI is the “Inflation number” you hear in the news.
Friday the PCE numbers will be released. Currently at 3% and may decline to 2.8% to 2.9%.
PCE gives a more inclusive look at all products and services from Urban and Rural consumers. CPI looks at Urban consumers only.
For example, both CPI and PCE measure the price of airfare, but CPI calculates it using a fixed basket of air routes, while PCE calculates it using data on airline passenger revenues and passenger miles traveled.
The key here is CPI excludes a vast amount of Data where PCE tries to grab as much information as possible. What is interesting and shown on the bottom graph, the numbers are pretty close.
-
The Sun is starting to shine, the Wheat is about ready to harvest.
The old catchphrase ‘Cut Wheat while it’s Sunny’ may be appropriate this spring. Rates continue their downward trend, and we hope it keeps going.
With that said, I’ve created a short animated YouTube video describing a typical refinance and its impact. Maybe convert that 30y into a 20y or 15y with the same payment.
You can find it on my channel, @HomeLoanDad.
Buyers are also starting to reenter the market. It’s time to check under the hood and get yourself pre-approved.
-
I told you so… Fed’s Pivoting to cuts in 2024 as soon as March.
Let’s break down what the Fed said at yesterday’s meeting. They sounded much more dovish than hawkish, notably stating that meaningful progress on inflation has been made and downgrading their view of the economy.
Powell mentioned that the Fed will not wait for inflation to reach their target before making cuts. Instead, they would act well in advance to account for the lags.
The prevailing thought is that once inflation is below 3% (currently at 3.14%), it will be the green light to cut.
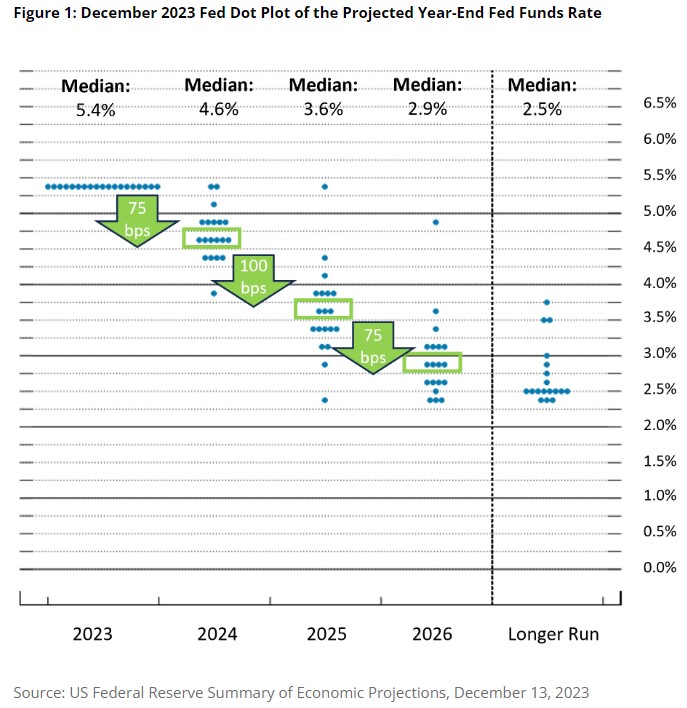
The Fed’s Dot Plot chart below is quite revealing. The majority believes that the Fed will cut between 50 to 100 basis points, with one member advocating for a 150 basis point cut and another proposing no cuts.
Each dot represents a Fed member’s projection of future rate cuts.
We are now at an 84% chance of cuts in March, aligning with my projections over the last few months.
-
Subscribe
Subscribed
Already have a WordPress.com account? Log in now.
