-
GDP growth slows, PCE Expectations tomorrow.
Q4 GDP – Gross Domestic Product grew at an annualized pace of 3.2%, which is a decline from the expected 3.3% and much lower than Q3 4.9%.
What this means is the economy is slowing. Not quickly which is good, but still slowing.
PCE – Personal Consumption Expenditures numbers come out tomorrow. The expectation is inflation will drop from 2.6% to 2.4-2.3%.
What this means is more data for the FEDs to start cutting rates.
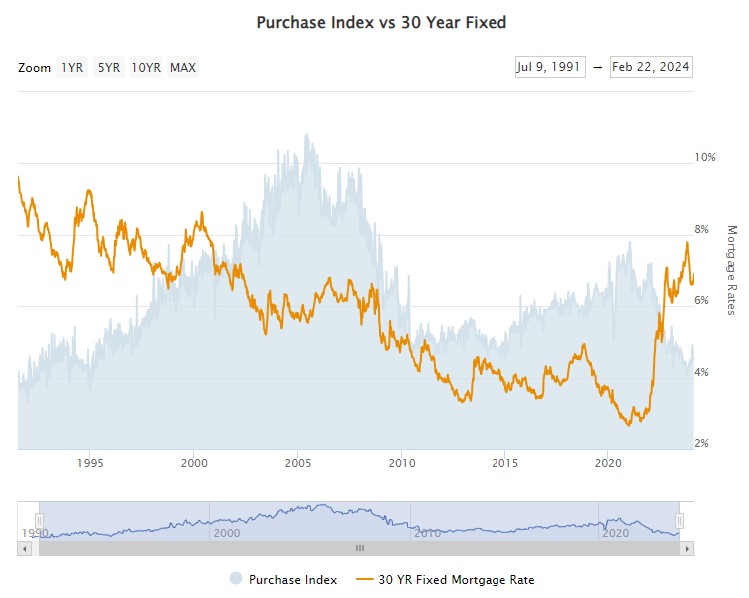
Below graph is the Purchase Volume vs the interest rate. You can clearly see the slowdown in the market.
What this means is less competition. Fewer purchase applications means less buyers to compete with.
-
Durable Goods Orders down 6.1% but wait a minute.
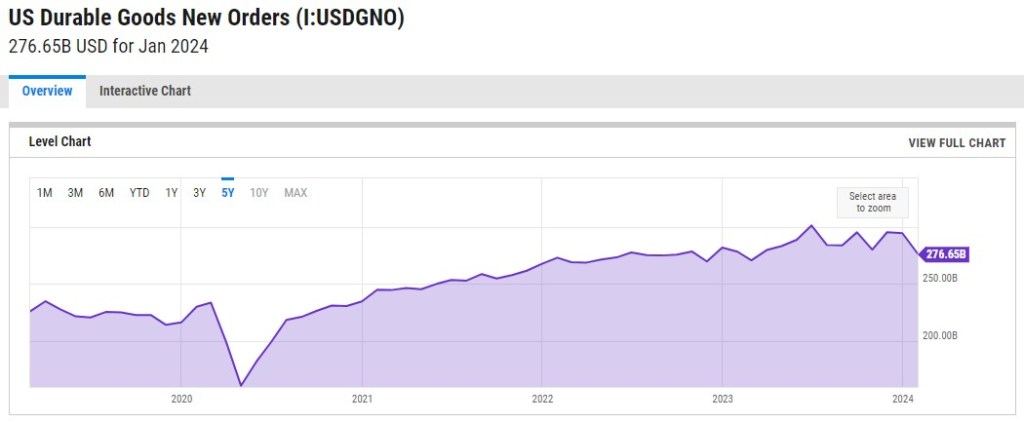
First lets define what this is. “Durable goods orders are new orders placed with domestic manufacturers for the delivery of long-lasting manufactured goods. The Census Bureau releases durable goods orders monthly as an economic indicator.”
The data is in: New orders decreased by 6.1% in January, a larger drop than the anticipated 4.5%.
Initially, this might trigger panic. It’s a significant decline. However, when viewed from a long-term perspective, orders remain substantially higher than pre-pandemic levels.
The Feds will see this as more data helping them lean into future rate drops.
-
Trading down and the impact to Retailers and Consumers.
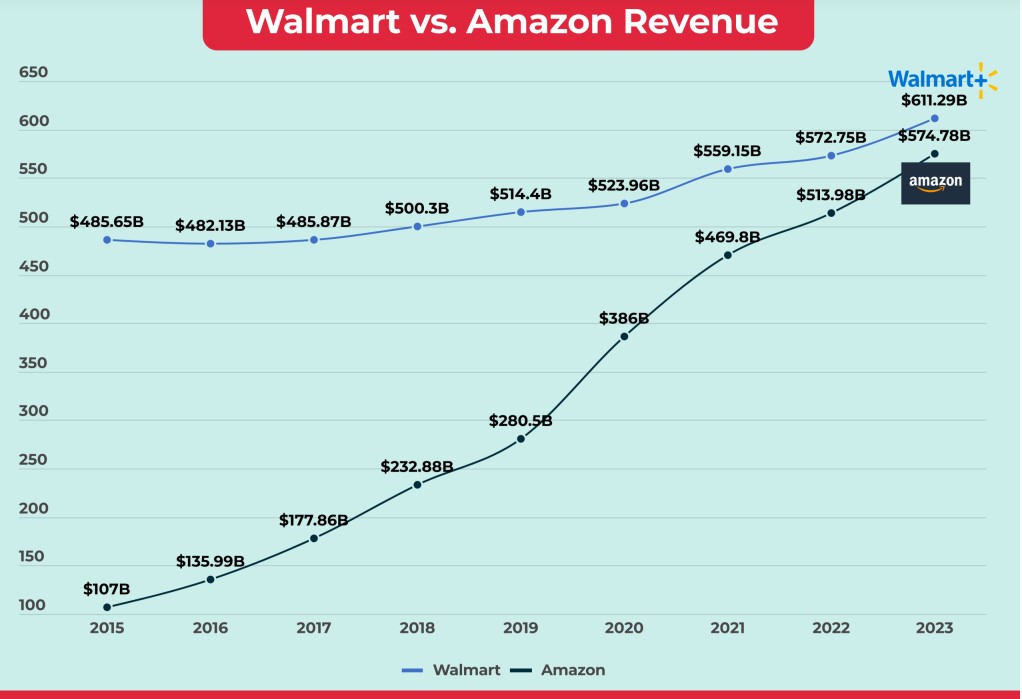
Your spending habits and decisions reflect those of the general population, and retailers are taking notice.
Walmart, the nation’s largest retailer, which typically benefits from these trade-downs, is also showing signs of weakness in the economy, with an average ticket price 4% lower compared to last year.
Think about what you have changed; it’s a good bet that other consumers have done the same thing. This is more information the Fed needs to pay attention to.
New home sales rose 1.5% in January, up 1.8% year over year. New homes measured by contracts have a 9.3-month supply, but only 80,000 of the 456,000 new homes for sale are completed.
The Thursday Personal Consumption Expenditures (PCE) report will be out, and it is one of the Fed’s favorite measures of inflation. Last week, we were hit with higher than expected CPI and PPI inflation reports.
The market is expecting PCE to decline from 2.6% to 2.34% or 2.3%. This is good news and further data pushing the Feds to start cutting rates.
-
“What’s the Rush?” says Fed Gov Waller. Well I can answer that.
Whether or not the voting members of the Federal Reserve are aligned, their message seems unified. All appears calm; why the haste?The Federal Reserve’s decision to lower rates will hold considerable significance for both homebuyers and sellers, irrespective of the actual drop in mortgage interest rates. It symbolizes the onset of a new chapter.
According to ZipRecruiter’s raw data, recruiting services experienced a decline throughout 2023, particularly affecting small to medium-sized businesses.
Of note, 80% of the job growth in 2023 stemmed from government, healthcare, and leisure & hospitality sectors.
Looking ahead to next week, we will have data releases including New Home Sales, Home Appreciation figures, GDP reports on Wednesday, and the PCE report on Thursday.
-
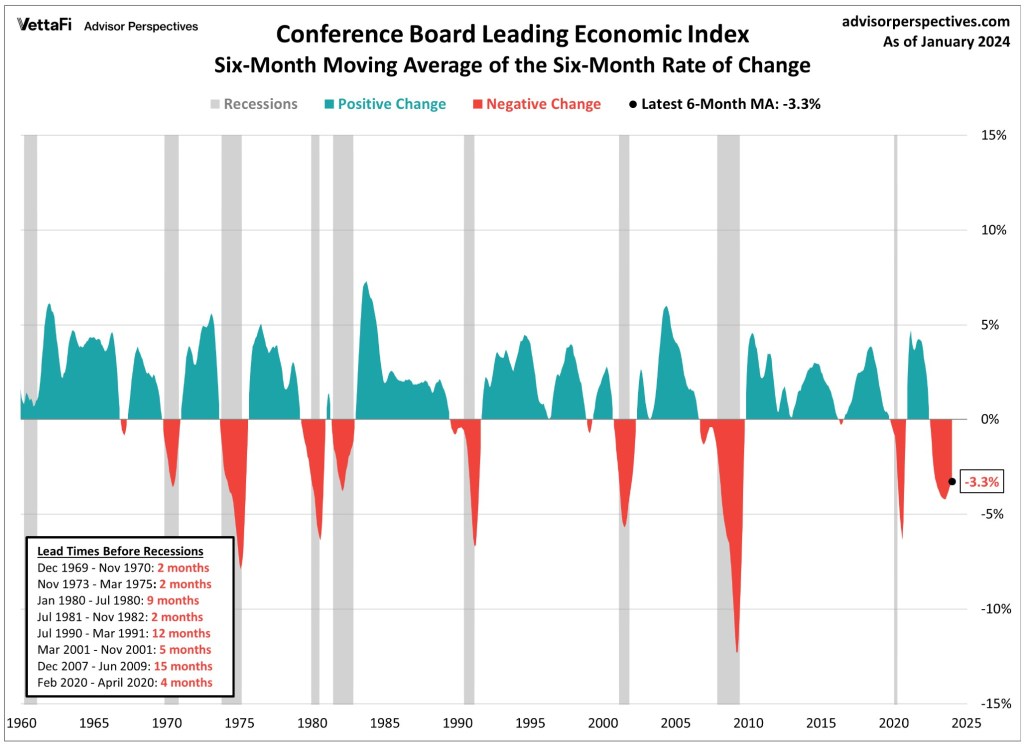
Looks like a Duck, Quacks like a Duck but wait, its not a duck?
Interesting comments this morning from the Conference Board who released their Leading Economic Index.
Here is the exact quote:
“The leading index currently does not signal recession ahead. While no longer forecasting a recession in 2024, we do expect real GDP growth to slow to near zero percent over Q2 and Q3”
Its called a Recession-Like Slowdown. Translation: Lower inflation and lower mortgage rates this year.
Applications are down 10% with year over year down 13%. You are being presented a gift. A gift of less competition.
-
Be Careful what Economy you create, the data will tell you exactly what you want.
The past year I have had the opportunity to write my daily thoughts of the World from a Mortgage perspective. The biggest challenge is making sure I’m not finding the data that represents my conclusion.
Most economists at best are wrong and at worst are completely wrong. The recent CPI, PPI and CPE data shows we don’t have a crystal ball.
Be careful of your internal bias because it’s very selfish and hungry.
My best guess is the Feds will now start lowering the Fed rate in June. By Summer we may be solidly in the low 6’s for interest rates and by winter in the 5’s.
-
A Piece of Sand does not make a Beach, but 10M might…
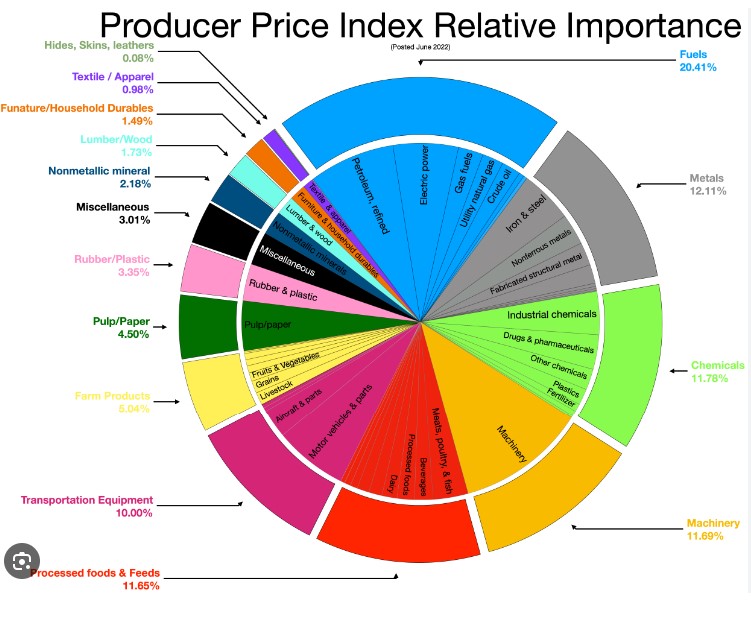
The Producer-Price Index – PPI rose 0.3%, and the Core PPI rose 0.5%, both far hotter than expected.
PPI measures the average change in selling prices received by domestic producers over time. It is a measurement of inflation at the wholesale level.
Let the significance of this sink in. This measures the change in prices before they reach the consumer.
The Feds look at this number more seriously because it has significantly more data points than the CPI and focuses on the cost of production, not the cost of consumption.
This does not bode well for Fed Rate Cuts in March or even June. This report reminds us we are not out of the woods despite how hard we stomp our feet.
-
What goes up Must come Down. Please…
Retail sales dropped by -0.8%, significantly below the anticipated -0.1%.Core retail sales also saw a notable decline of -0.4%, falling short of expectations.
Initial jobless claims decreased by 8,000 to 212,000, marking the first decline.
Continuing claims, however, increased by 30,000 to 1.895 million, reaching their second highest level since November 2021.
Capacity utilization, specifically in industrial production, decreased by 0.1%, highlighting ongoing manufacturing weakness.
Japan’s Q4 GDP figures remained negative for the second consecutive quarter, echoing similar economic struggles in Europe.
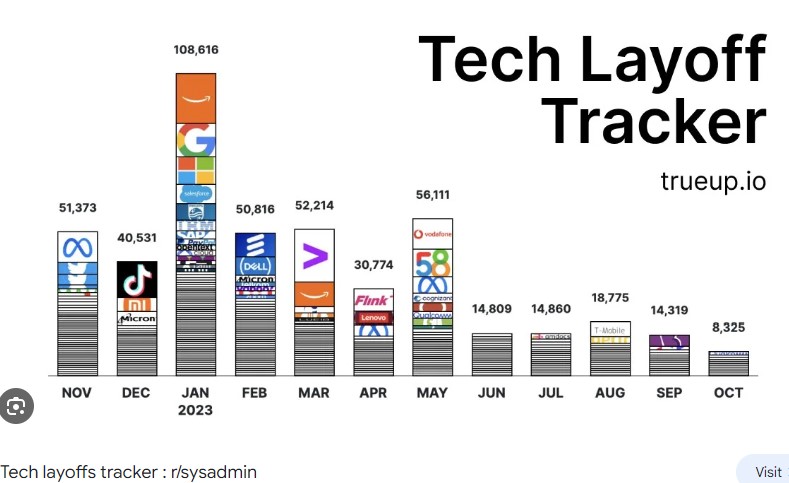
Despite reports of tech layoffs dominating headlines, last year actually saw more significant job cuts in the sector.
-
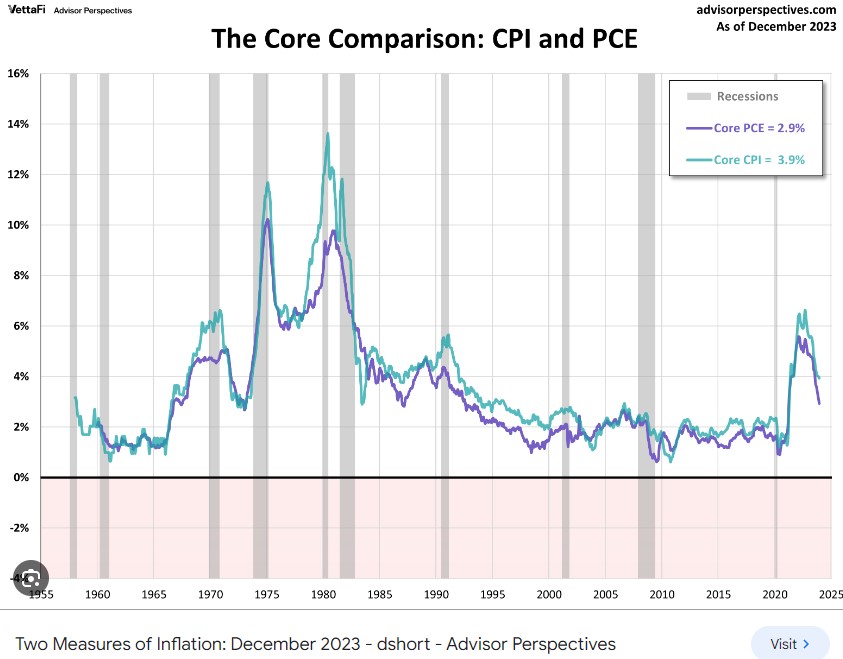
Divergence between CPI and PCE and why it matters more than you think.
Let’s Talk CPI and PCE. it’s important so put down your cell phones and pay attention.
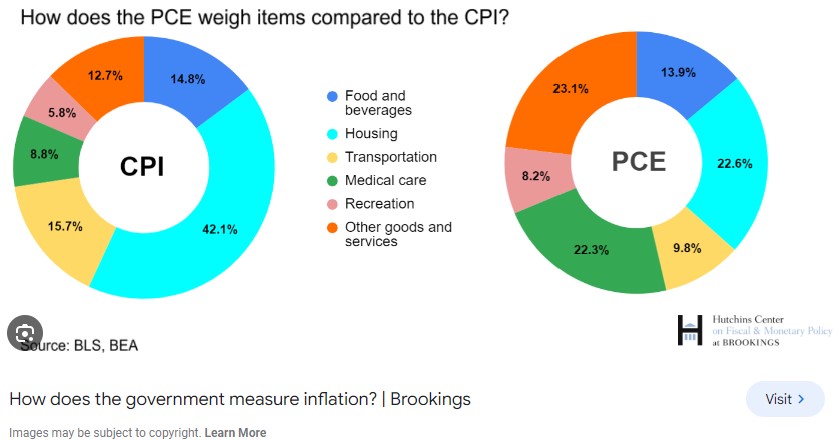
CPI updates the “weight” of its items Annually, while PCE updates Quarterly. So what does that mean?
CPI typically has a higher inflation rate because they can not capture in relative real time consumers switching to cheaper products.
To get a bit further in the weeds, CPI only captures a narrow definition of Urban consumer expenditures made directly from Consumers. PCE considers expenditures made by all consumers as well as those made by other third parties.
Here is an example: A Healthcare insurance provider who purchases prescription drugs on behalf of patients. PCE weighs health care at 22.3% while CPI is at 8.8%.
The second graph demonstrates the divergence and that we are closer to the target 2.0% inflation than we realize.
-
I wanted the whole Pie, not just 7/8s of it… PCI numbers hot.
The good news is that the PCI numbers show a year-over-year inflation decrease from 3.4% to 3.1%. The problem is, we Buruca’ed it.
The Core rate, which strips out food and energy prices, increased by 0.4%, one-tenth higher than expected.
Here are the numbers:
Energy prices fell by 0.9%, gasoline dropped by 3.3%, and used car prices decreased by 3.4%.
Shelter costs, which make up 44% of the index, rose by 0.6%. Lodging away from home also increased by 1.8%.
Auto insurance, which accounts for 3.6% of the inflation reading, rose by 1.4%.
The bottom line is, inflation is decreasing, just not as rapidly as we expected or anticipated. We’re all ready to Get-to-Getting but are struggling to move forward.
-
Subscribe
Subscribed
Already have a WordPress.com account? Log in now.
