-
The Sky is not Falling. Keep Calm and Carry on.
The Personal Consumption Index (PPI), which measures wholesale and producer inflation, rose by 0.2%, falling below expectations. However, food prices saw a notable increase of 0.8% month-over-month, which is lower than February’s 1.1% hike.
The Core rate, which excludes food and energy prices, rose within expectations.
It’s important to avoid knee-jerk reactions in response to these fluctuations. Instead of watching dogs wagging their tails to predict where things are going, it’s wiser to follow the footprints.
In the background over the last two plus years, the Fed has been engaged in Quantitative Tightening, meaning they’ve been gradually selling off their balance sheets, including Treasuries and Mortgage-Backed Securities, for years now.
Now, they’re considering Quantitative Easing, which is essentially the reverse. This is a strategy previously employed post-2008 financial crisis and more recently during the 2020 pandemic.
When the Fed purchases Securities and Mortgage-Backed Securities, it typically leads to a drop in rates.
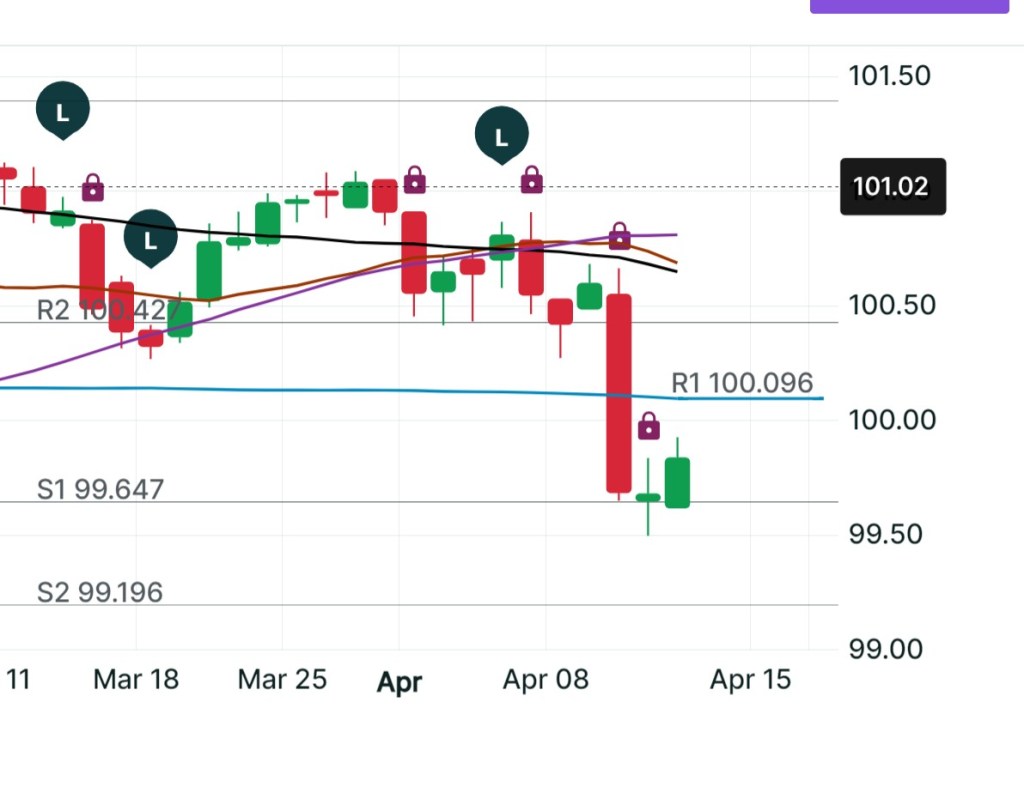
Wednesday as evident in the graph below, was tough on rates. Down is lower rates. This represents about a 3/8 increase in rates. Since then we are starting to recover.
-
So where do we go from here? CPI 3.5% expected 3.4%
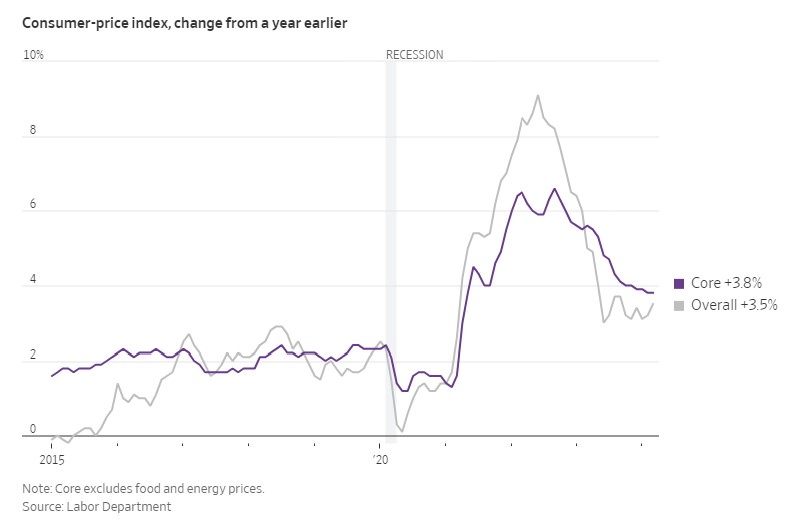
The Consumer Price Index (CPI) rose by 0.4% in March and 3.5% year over year, slightly exceeding our expectations of 0.3% and 3.4%, respectively.
The larger concern arises from the fact that both January and February also experienced higher-than-anticipated increases.
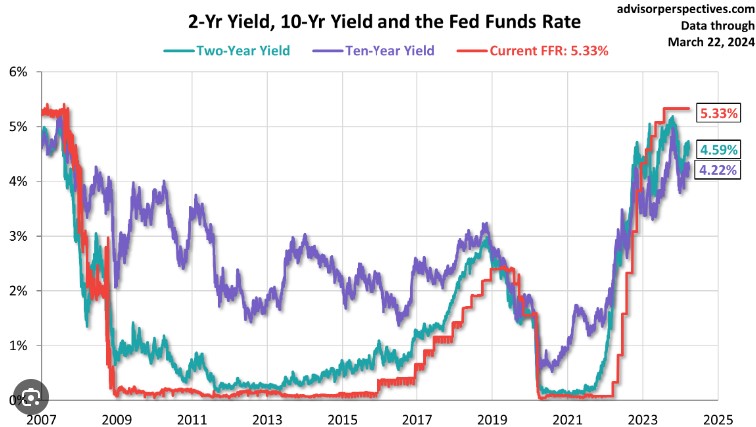
The bottom line is that the Federal Reserve (FEDs) is not pleased. Additionally, the differential between the 2-year and 10-year bond inverted yield curve is troubling. An inverted yield curve means that shorter-term yields are higher, which, upon reflection, doesn’t seem logical.
In theory, holding money for a longer period should yield higher returns.
Let’s all take a deep breath and review the graph below. Inflation is down significantly. It’s just not where we or the Federal Reserve wants it.
-
Sometimes the Problem is the solution you have been avoiding.
It suggests that the solution to a problem may actually lie within the problem itself, and by addressing the problem directly, you may find the solution you have been avoiding.
The Bond Market has sold off in the last few weeks, putting pressure on mortgage rates. Consequently, the markets have less confidence in a 25-basis-point rate cut in June.
Inflation is stubborn; it’s not our friend and is effectively holding everyone back. We anticipate inflation to increase from 3.2% to 3.4%.
Shelter costs, which make up 45% of the Core CPI numbers, are not slowing down or have stalled.
The problem is that we keep waiting for the next turn to make a decision, but that turn just looks like the previous one. Rates are a problem because we are making them our problem.
I may not be telling you what you want to hear but sometimes the truth hurts a bit.
-
A funny thing happened on the way to the Forum.
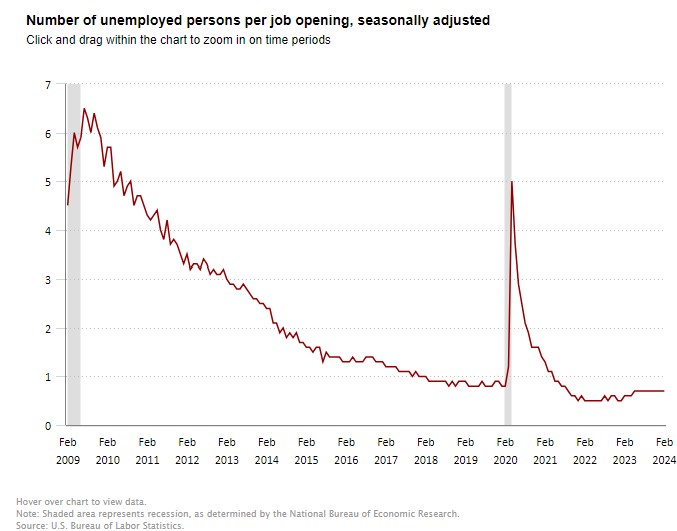
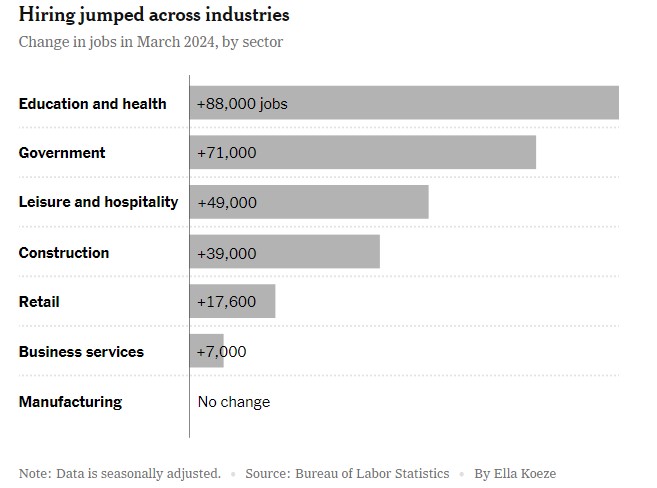
The jobs report came in much hotter than expected, but there is a silver lining. When there are as many job openings as there are job seekers, that equilibrium results in a net zero gain on inflation and no wage pressure.
Think of it this way: if you were looking for a job and received five offers, you could negotiate higher pay or better benefits.
Consider these two real-life scenarios: if you are competing with 100 other candidates for the same job, good luck negotiating anything.
However, if employers are eager to fill job openings and need to attract more candidates, what better way to do so than by increasing salary or benefits? This can be an inflationary component.
the Unemployment rate dropped from 3.9% to 3.8%. Our gut is thinking the Feds are going to freak out. Maybe not considering the above.
-
Service Prices have Fallen. Index is leaning to positive PCE numbers ahead.
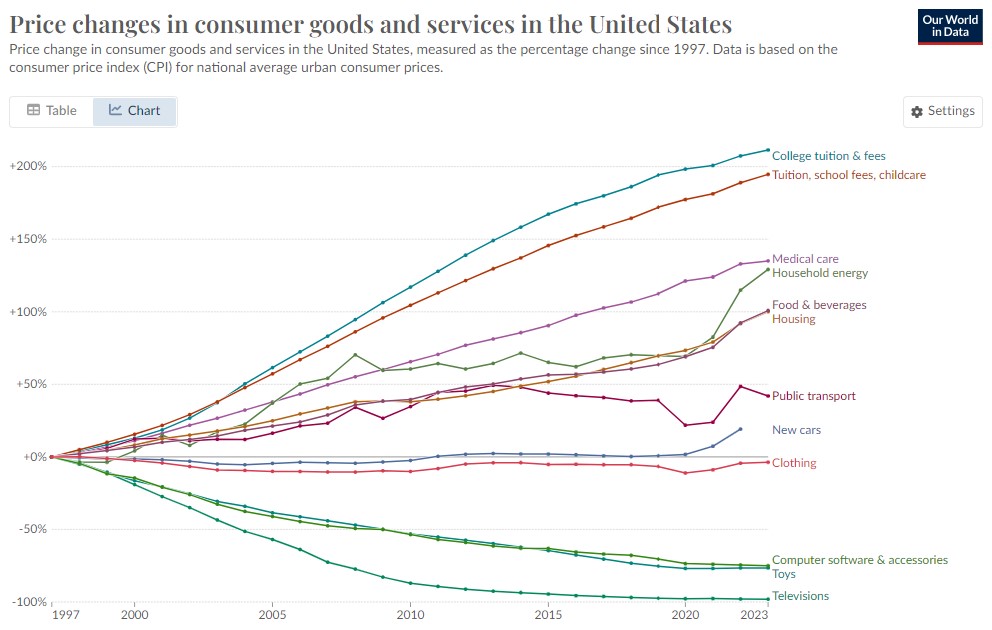
One of the components of inflation is the change in service prices of consumer goods and services. It fell sharply by 5.2 points to 53.4.
This is a leading indicator for the Personal Consumption Expenditures (PCE), a favorite inflation gauge of the Fed.
Employment increased slightly from 48 to 48.5. Employment has been contracting, as have backlogs. A backlog refers to a buildup of work that has not been completed in a timely manner.
The bottom line is that we are seeing mixed signals in the economy, with some pointing towards a recession and others not.
From my perspective, it feels like the anecdotal part of our brain is saying, ‘Hey, something’s up, I just can’t put my finger on it.’ This is good news for interest rates in the future and the kind of news the Fed wants to start seeing before they initiate rate adjustments.
-
When Growth in not a good thing.
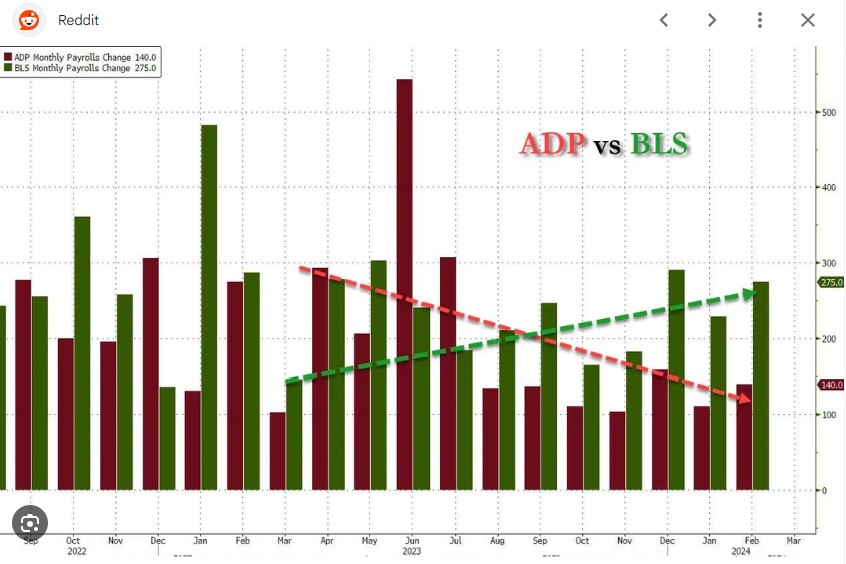
ADP’s private payroll data, released this morning, showed higher growth than anticipated, with 184,000 jobs added in March compared to estimates of 155,000.
Bond traders are currently pricing in a 62% chance of the first Fed rate cut in June, down from 70% last week according to the CME FedWatch Tool.
As the Bond Yields go, so goes the Mortgage Rates.
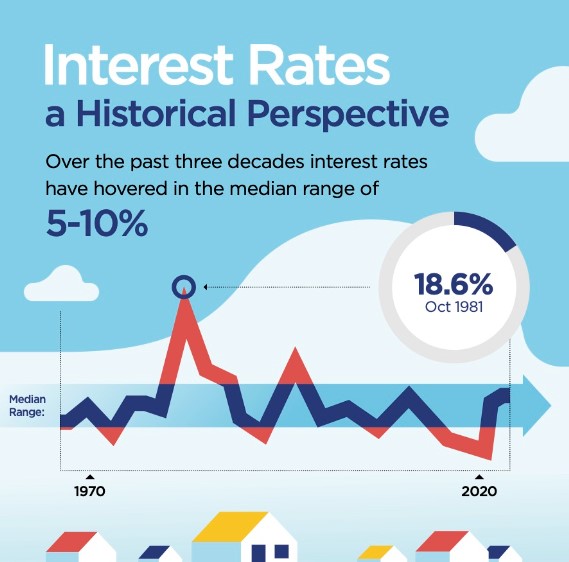
The graph below provides a clear illustration of the current and historical trends of the Fed rate, closely correlating with mortgage rates.
-
How can I miss you if you won’t go away
I hope this letter finds you well, although I have to admit, I’m not exactly shedding tears over our impending breakup. It’s time we had a little chat, you and I. You see, things between us just aren’t working out anymore.
I know, I know, we had some good times. Remember when we used to laugh together about rising prices and shrinking purchasing power? Ah, the memories. But lately, it’s like you’ve become this clingy, suffocating presence in my life. Every time I turn around, there you are, making everything more expensive and causing chaos in the economy.
I’ll never forget the time you inflated my grocery bill so much that I couldn’t even afford avocados anymore. And don’t even get me started on what you did to my gas prices. It’s like you took a personal vendetta against my wallet.
But hey, I’m not one to dwell on the negatives. I’ve decided it’s time for me to move on and find someone who treats me right. Someone who won’t constantly drain my bank account and wreak havoc on my financial stability.
So, consider this letter my official notice: it’s over between us, Inflation. I’m breaking up with you. And don’t even think about trying to win me back with your flashy promises of economic growth and prosperity. I’m onto you now.
Goodbye, Inflation. It’s been… well, it’s been something.
Sincerely, Me with the help of ChatGPT
-
I’m Crossing the I’s and Dotting the T’s. Reverse that…
Today’s market reaction is influenced by Friday’s data, particularly the release of the Personal Consumption Expenditures (PCE). PCE rose by 2.8% year over year, with a 0.3% increase from January.
While these numbers were within expectations, they raise the likelihood that the Federal Reserve will hold off on cutting rates in the near term.
Looking ahead to Jobs Week, the ADP and BLS Jobs Reports are set to be released on Wednesday and Thursday, respectively. The market anticipates the creation of 130,000 jobs for ADP and 200,000 for the BLS report, with the unemployment rate expected to remain at 3.9%.
It’s almost as if I could pull up a post from two months ago and be saying the same thing. It feels like we’re waiting around for just the right song to gather our nerve and ask that girl to dance.
Problem is, the song isn’t changing, and we need to get moving.
-
Personal Consumption Expenditures (PCE) Lighter than Estimates.
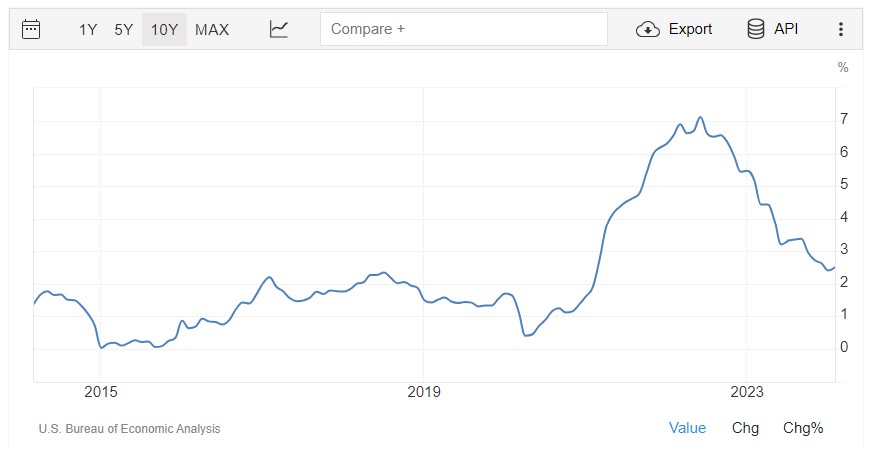
Getting straight to the point, the Personal Consumption Expenditures (PCE) index didn’t show significant changes. Year-over-year inflation increased from 2.4% to 2.5%, as we had anticipated, with energy costs rising by 2.4% in February, serving as the main driver.
The core rate, which excludes food and energy, rose by 0.3%, in line with expectations.
However, the overall index decreased from 2.9% to 2.8%.
Inflation seems to have stalled, leaving us in somewhat of a limbo situation at the moment.
The graph below illustrates the progress made in reducing inflation
-
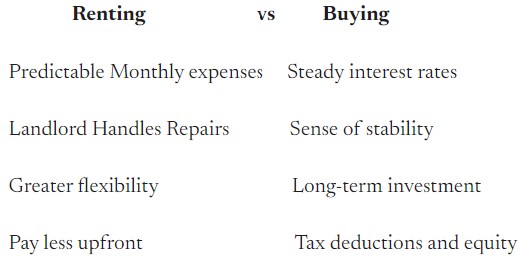
Are You a Renter? If so you are already paying a Mortgage, just someone else’s.
Pending Home Sales, which measures signed contracts on existing homes, rose 1.6%. Apartment List Rental Report, showing new rents rose 0.6%, down from 0.8% year over year.
Q4 GDP Reading, showed the US grew at a 3.4% annualized pace. increase from 3.2%. Quarterly PCE Core remained at 2%, lower than estimates. Q4 was strong but typical for the Seasonal spending.
Initial Jobless Claims fell 2,000 to 210,000, which is lower than expected. Continuing Claims rose 24,000 to 1.819M. What this means is Employers are less likely to kick you to the curb, but also means it’s harder to find a job.
-
Subscribe
Subscribed
Already have a WordPress.com account? Log in now.
