-
Rates hold onto gains this week. Fed Minutes out today.
At 11am PST the Fed Minutes for the May 1st Fed meeting will be released.
- Next move may not be rate hike
- Inflation continue to stall.
- Unemployment rate going up
- Feds slowing down Balance sheet reduction (quantitative tightening)
- Feds increasing their Balance sheet (quantitative easing) -good for rates
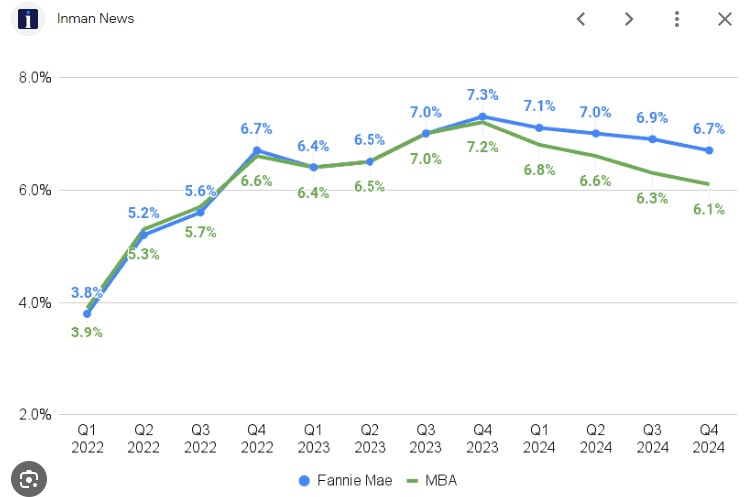
Existing home Sales
This is the sale of existing homes not new builds.
- Fell 1.9% in April. Slightly lower than expectations
- Higher rates in February did not stall sales
- Inventory increased 9% mont/month
- Inventory up 16% from last year.
- Median home price up 3.7% to $407,600
The bigger news is first time home buyers make up 33% of the sales, which is up sharply. Cash buyers accounted for 28%, Investors 16%.
27% of homes sold above the list price. Mortgage applications down slightly and 11% lower than this time last year.
Inventory is headed in the right direction and with fewer borrowers looking, Now might be the right time to make your move.
-
8 Fed Members Speaking this week. What to expect and what we know this morning.
Raphael Bostic a voting member and Fed President said he thinks inflation will continue to come down, but slowly. He has talked to a lot of business leaders, and they are all telling him that things are slowing down.
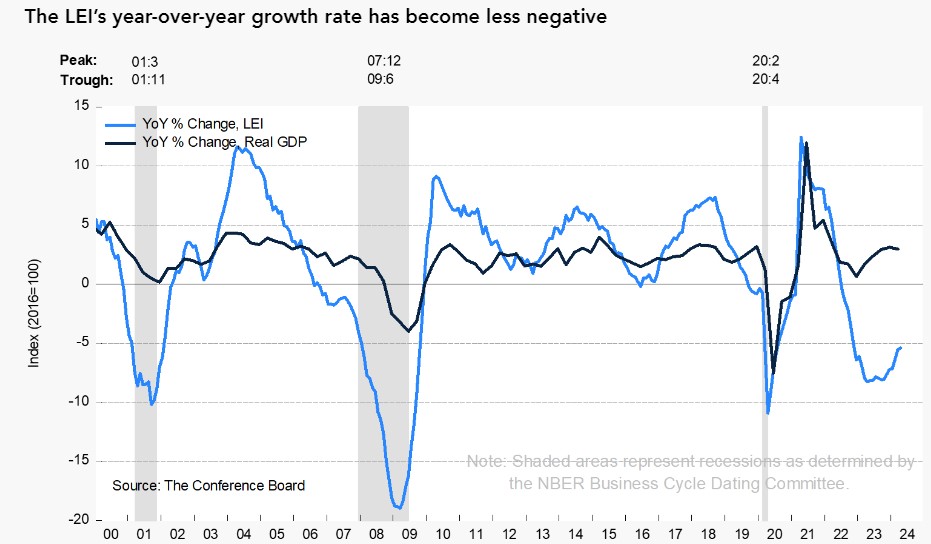
Leading Economic Index
The Conference Board released their LEI, which decreased in April by 0.6%. We have had 22 months of negative readings in a row. This points to serious headwinds to growth ahead.
What’s going on this week
- Tuesday: CoreLogic Rent Index
- Wednesday: Mortgage Apps, Existing Home Sales, 20-year bond Auction, Fed Minutes
- Thursday: initial Jobless Claims, New Home Sales
- Friday: Durable goods Orders.
How will this affect Mortgage Rates?
What the Federal Reserve is hearing from the market aligns with the broader economic observations both anecdotally and technically. This indicates that the Fed is analyzing the data and recognizing that a recession may not be imminent. However, they might need to reconsider implementing rate cuts sooner rather than later.
Translation
Mortgage Rates should move in a positive direction moving forward.
-
Trading Down, Feds are you Listening?
Being in this business for over 20 years, there are words that stick out like a sore thumb.
One of those words is Trading down. During the 2008 Financial crises, I recall the headlines about how well the beer industry was doing. Generic brands got a boost as did other Trading Down brands.
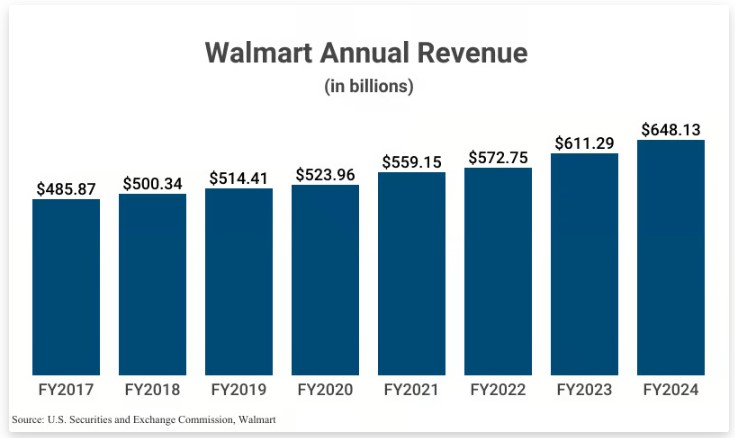
Walmart posted strong earnings yesterday. The reason this is important is they are a good barometer on the overall economy.
The higher income earners are Trading Down. They have a long way to drop opposed to lower income consumers who are close to the bottom. This is a sign that consumers are struggling with the pandemic savings exhausted and personal savings rate at very low levels.
Credit appears to also be tapped out. Buy now pay later has a very high delinquency of over 43%.
-
It’s not Free, but it’s just Free enough.
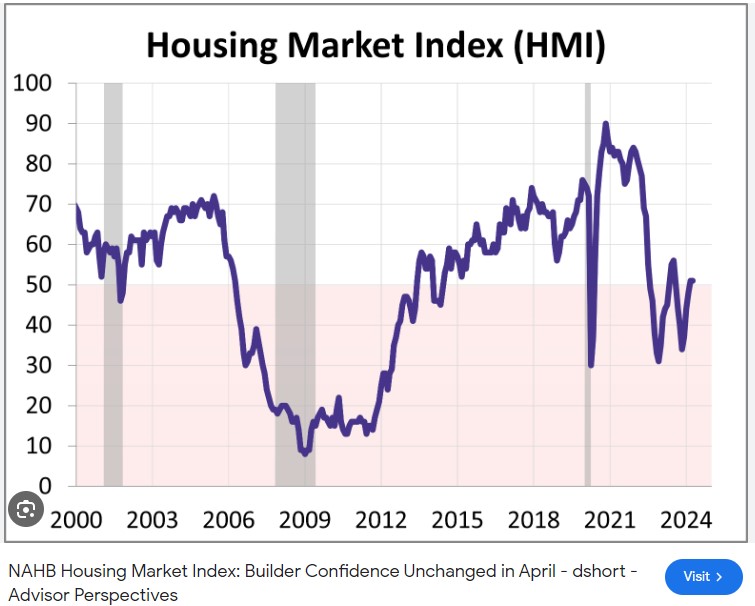
The use of sales incentives ticked up to 59% in May. The May HMI survey shows 25% of builders cut home prices to boost sales.
Its a builder confidence thing. The May NAHB Housing Market Index, which measures builder confidence, fell 6 points to 45. It’s under the 50 number but this is still an expansion confidence. Weak but still confident.
Initial Jobless Claims fell 10,000 to 222,000. This is higher than previous levels.
Continuing Claims rose 13,000 to 1.794M. These are the highest numbers since November 2021.
Big bond movement yesterday and holding onto those gains today.
-
Progress not Perfection – Inflation behaving itself
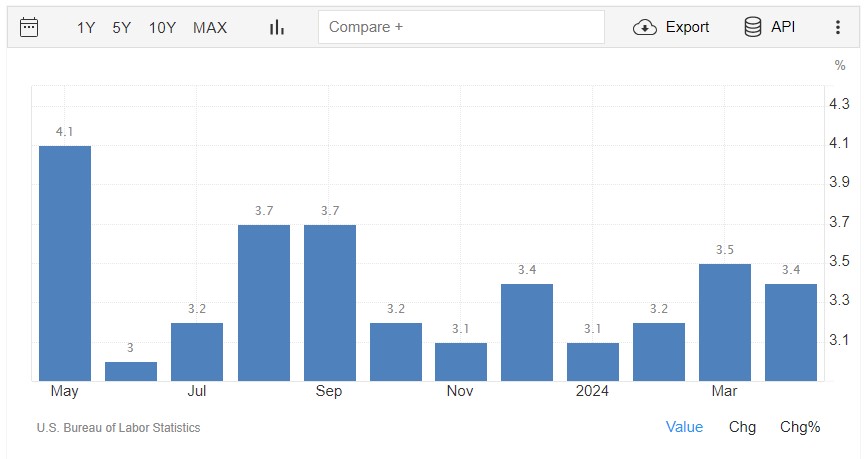
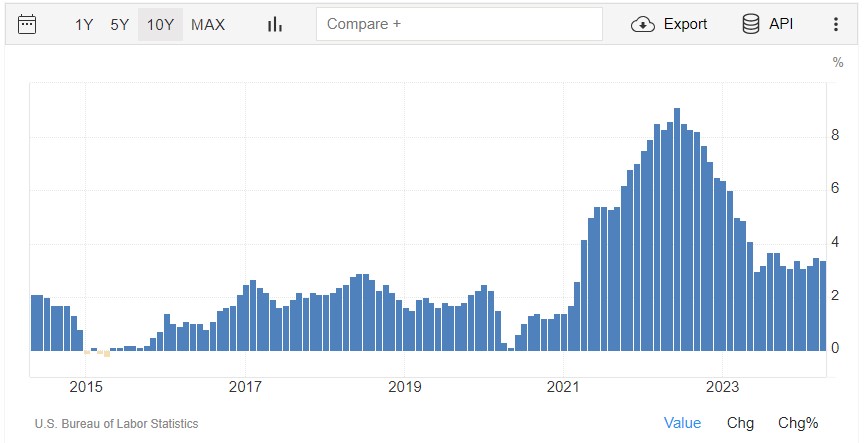
The Consumer Price Index (CPI) for March showed inflation rose by 0.3%, which is cooler than the estimated 0.4%. Year-over-year inflation decreased from 3.5% to 3.4%.
The core rate, which strips out food and energy, increased by 0.3%, as expected.
Here are the numbers:
- Energy prices rose by 1.1%
- Gasoline prices increased by 2.8%
- Auto insurance rose by 1.8%, up 23% year-over-year
- Used car prices fell by 1.4%, and new car prices dropped by 0.4%
- Shelter costs, which make up 45% of the CPI, rose by 0.4% but declined from 5.7% to 5.5% year-over-year
- Rents, similar to shelter, declined year-over-year from 5.7% to 5.4%
- Retail sales were flat, compared to an expected 0.4% increase.
The market is pricing in two rate cuts by the end of the year. These numbers strongly indicate that inflation is dropping and that the dreaded word “stagflation” will not rear its head.
-
It’s Hot in here, Oops sorry BLS report revisions.
It’s all about inflation, and when the Bureau of Labor Statistics (BLS) makes revisions, like they did in March, it becomes difficult to determine the true inflation figures.
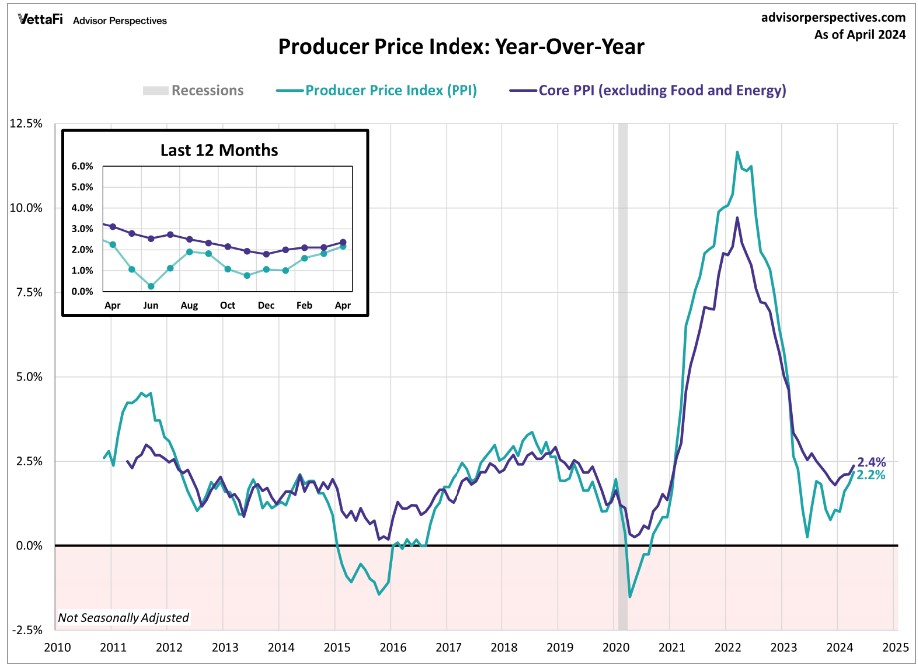
The Producer Price Index (PPI) report, which measures wholesale or producer inflation, rose by 0.5% in April. That is a much hotter number than the expected 0.4%.
The reason for this disparity lies in how these numbers are calculated. Inflation is based on a comparison of previous data, either from the last month or the last year as an example. Remember Inflation is the change in pricing from a previous data point.
Tomorrow’s Consumer Price Index (CPI) should shed some light on inflation, as it is a more crucial data point than the PPI.
What this means is the Feds should start thinking rate cut starting in June and potentially cutting mid summer. This is a positive outlook for interest rates.
-
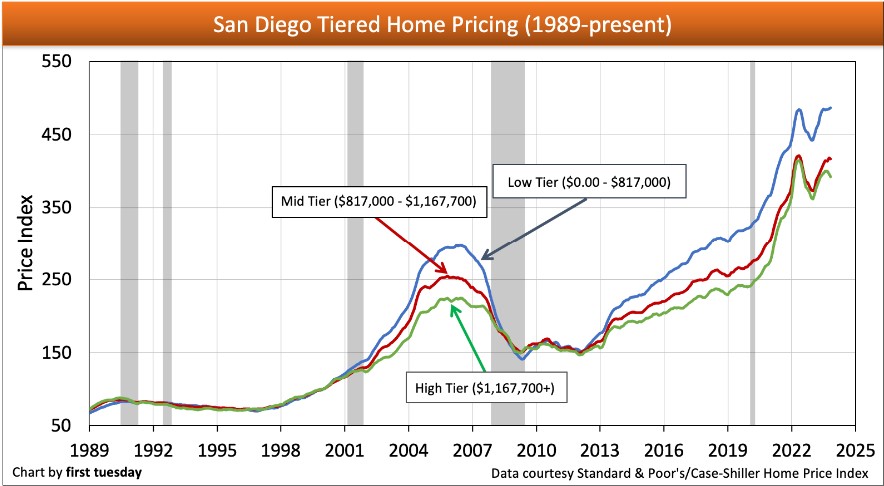
Home Values Continue to Rise.
CoreLogic Home Price and Black Knight HPI both show strong home prices.
CoreLogic reported home prices rose 1.2% in March. This is showing an acceleration from 0.7% in February. Year over year, home prices are now up 5.3% CoreLogic has bumped up their forecast for next month to 0.8%.
Black Knight reported prices rose 1.2% in March and 5.6% year over year.
Real estate remains a robust investment option, even with current rates surpassing those of two years ago. Concurrently, home values continue to climb, making it an opportune time to invest.
Inflation has a fight on its hands. We have seen inflation stall but there is hope on the horizon.
The NY Fed Supply Chain Pressure Index fell from -0.3% to -0.85% in April. this is the lowest figures since August of last year when we saw great progress on inflation.
Oil prices have a big influence on core readings but over the last few weeks, we have seen oil prices decline by roughly 11%.
Stay resilient; I anticipate a significant drop in inflation, driven not only by the factors mentioned above but also by major players in the food industry, such as McDonald’s, scaling back on their historically aggressive stances in recent years.
-
4,094 People are relying on you. Don’t mess this up.
In order to be born you needed:
- 2 Parents
- 4 Grandparents
- 8 Great-Grandparents
- 16 Second Great-Grandparents
- 32 Third Great-Grandparents
- 64 Fourth Great-Grandparents
- 128 Fifth Great-Grandparents
- 256 Sixth Great-Grandparents
- 512 Seventh Great-Grandparents
- 1,024 Eight Great-Grandparents
- 2,048 Ninth Great-Grandparents
For you to be bon today from 12 previous generations, you needed a total of 4,094 ancestors over the past 400 years.
Think for a moment about how many struggles, how many battles, how much sadness, happiness, love stories, and hope for the future that you ancestors had to undergo for you to exist in this present moment. –Nathalie Anna
Interest rates are rebounding. Get out there and get to getting…

-
BLS and ADP who is correct. Both lower than expectations. Unemployment 3.9%
Here’s an interesting twist to the Bureau of Labor and Statistics (BLS) report of 175,000 jobs created. If we look at the Birth/Death or online vs offline company starts and fails, the jobs report would have been -188,000.
Not trying to be a downer in all this but the reality of the job market became much clearer this morning despite the best efforts of those reporting the numbers this past year.
The Federal Reserve relies heavily on accurate data for decision-making, and uncertain data requires time for analysis.
By the numbers:
- Jobs Created 175,000 expected 243,000
- Unemployment was 3.8% now 3.9%
- Hourly earnings rose 0.2% expected 0.3%
- Weekly hours worked decreased from 34.4 to 34.3
These figures suggest a weakening job market, which could influence interest rate decisions. There’s pressure on the Federal Reserve to consider a rate cut in September rather than waiting until November.

-
Hedonic Treadmill -what goes up must come down.
An individual’s level of happiness tends to return to its baseline after experiencing either positive or negative life events, a phenomenon known as the Hedonic Treadmill.
Consumer Confidence, gauged by factors such as job availability, difficulty in finding employment, and expectations for future job prospects, has recently shown a decrease in the perceived availability of jobs (a 1.5-point drop), an increase in the perceived difficulty of obtaining jobs (a 2.7-point rise), and a decrease in expectations for future job opportunities (a 2.6-point drop).
However, these indicators contradict the current unemployment rate at 3.8%.
Getting into the weeds but lets take a deeper look. There are two key Census readings. 12M entities with the Census and 700k in the BLS report. Census data shows 192,000 job losses vs the BLS showing 521,000 job gains.
The Feds lean into the BLS report.

-
Subscribe
Subscribed
Already have a WordPress.com account? Log in now.
