-
Excess Monetary Restraint. An argument for Wednesday FED rate cut.
That’s an exciting headline! I’ll do better tomorrow.
There’s whisper talk among the money managers who control vast resources of bond and pre-bond funds. Have you ever woken up in a cold sweat, knowing you should have done something the day before but still might have a chance to act on it?
That’s exactly what’s happening now. For the first time, I sense these long-term bond managers are sweating bullets. Should they buy now while the yields are still high, or wait and see what happens?
The Federal Reserve is also feeling that same cold sweat. Have they waited too long, or not long enough? The cure now seems worse than the ailment.
Below is the packed week of reports from Jobs to housing.
- Tuesday: Case Shiller HPI, FHFA, HPI and JOLTS
- Wednesday: ADP Employment, Pending Home Sales, Fed Meeting
- Thursday: Initial Jobless Claims
- Friday: BLS Jobs Report.
-
Inflation Down to 2.5%. Last Three Months annualized tracking 1.5%.
Personal Consumption Expenditures (PCE) rose by 0.1% in June, in line with expectations. The notable news is that inflation dropped to 2.5%.
Shelter costs increased by 0.27% in June, which is a significant improvement from the 0.42% rise in May.
Incomes increased by 0.2%, while consumer spending went up by 0.3%. As a result, the savings rate decreased from 3.5% to 3.4%.
Although this report wasn’t as dramatic as anticipated, it still indicates to the Federal Reserve that the economy is stabilizing and inflation is decreasing.
This is promising news for the Federal Reserve to potentially start cutting rates in September. While I may sound repetitive, be prepared for rates to make a significant move into the 5% range in the coming year, which could open the floodgates.
We offer Soft Credit Pulls, so whether you’re an agent or a borrower, make sure to be prepared. Encourage both buyers and sellers to get ready.

-
GDP “Inventory Build” and why that is important to understand.
Q2 Gross Domestic Product – GDP, is the total monetary or market value of all the finished goods and services produced within a country’s borders in a specific timeframe.
The Q2 GDP report indicated that the US economy grew by 2.8%, but 0.82% of this growth was attributed to “Inventory Build.”
When we mention Inventory Build, it means there is now an excess of inventory, which is a crucial factor to consider. Additionally, Durable Goods Orders dropped by 6.6% in June, significantly weaker than the estimated 0.3%.
As a side note, the primary reason for this decline was a reduction in aircraft orders, or the lack thereof.
Initial Jobless Claims as well as Continuing Claims fell slightly but still remain around the highest levels in three years.
We continue to see rate improvement, though slight, it is still headed in the right direction. The Federal Reserve have an option to lower the FED rate next week but lets not get our hopes up yet.
-
Can I rant about the Birth/Death Model again… I have to.
The BLS Jobs report significantly depends on the birth/death model, which estimates job gains and losses by analyzing company startups and closures to determine their impact on employment.
The QCEW – Quarterly Census of Employment and Wages released their Q4 job revision data. They stated only 344,000 jobs created vs the BLS report of 637,000.
Herein lies the issue: the market reacts to this data, and if it is filled with estimates, projections, and guesswork, it can lead to inaccurate perceptions and decisions. This reliance on potentially imprecise data can cause volatility and misguided strategies, affecting investors, businesses, and policymakers who depend on the accuracy of these reports for economic planning and forecasting.
The FEDs rely on this data, and in my opinion, they are too data-driven, especially when there are wild inconsistencies in how the data is collected and interpreted.

-
I’ve Trimmed the branches and the limbs, now it’s time to hit the trunk.
As economic data continues to suggest a soft landing and no recession, we have effectively trimmed the branches and limbs.
Now it’s time to tackle the core issue of interest rates. Our problem lies with the high Federal Reserve rate.
Prolonged high borrowing rates for businesses result in increased costs for borrowing and expansion. Ultimately, it’s the consumer who bears these costs.
At this point, the cure is worse than the disease.
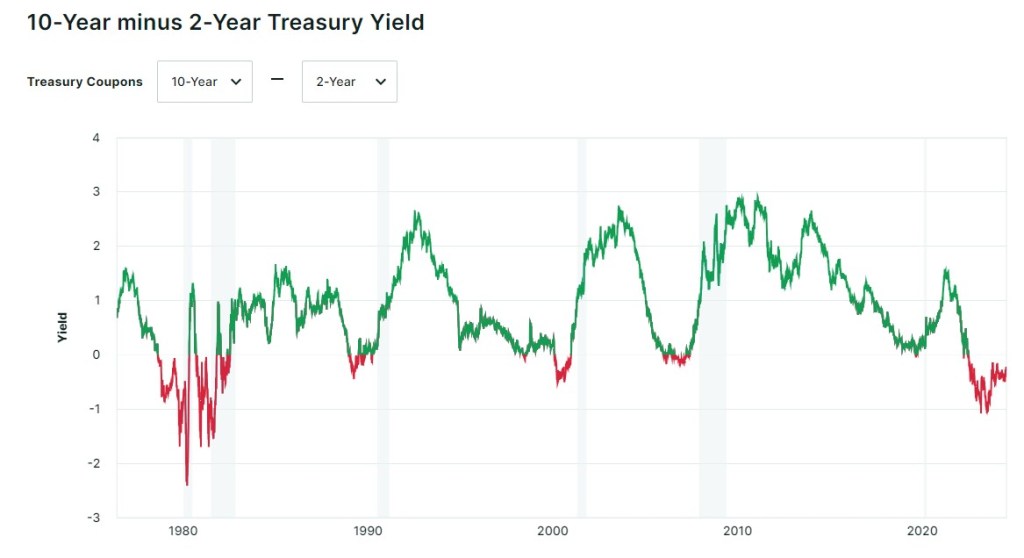
The graph below demonstrates the differential between the 10-year and 2-year yields. Currently, the 2-year yield is higher than the 10-year yield, an unusual situation that is evident in every recession.
However, in our case, we are moving in the right direction, as indicated by the green trend. This is another sign of potentially lower interest rates in the near future.
-
Get Ready for the Refinance avalanche
Looking at loans originated between 2022 and 2024:
- 2M with rates between 6% and 6.5%
- 2M with rates between 6.625% and 7%
- 2M with rates above 7%
We are advising clients to hold until there is a 1-point drop in their current rate. However, even a 0.5% rate drop might take only 12 months to recover the associated costs.
As we get closer to borrowers’ past low rates, the potential for either refinancing or selling and buying increases significantly. The pool of borrowers is much larger:
- 5.5%: 9.5 million borrowers with rates of 4.5% or higher
- 6.125%: 7.5 million borrowers with rates of 5.125% or higher
- 6.625%: 5.5 million borrowers with rates of 5.625% or higher
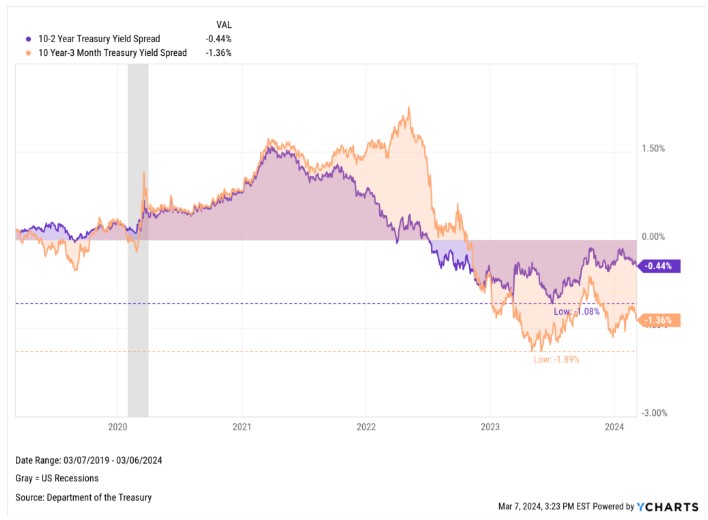
Once the Fed starts cutting rates, short-term rates will fall, and the inverted yield curve (where the 2-year yield is higher than the 10-year yield) will revert. This means ARM loans will become more favorable.
Bottom line: a wave of opportunity is coming. Get ready by getting pre-approved, dusting off those W-2s and pay stubs, and preparing to act.
-
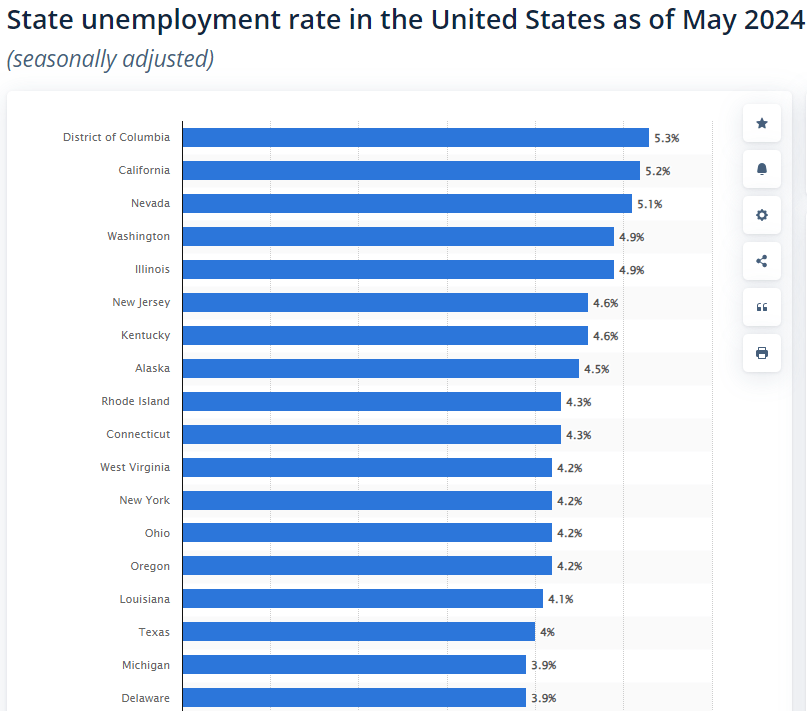
Unemployment by the numbers
Jobless claims are rising nationwide. When examined on a state-by-state basis, 24 states, accounting for half of the population, have higher year-over-year claims. In contrast, in June, only 11 states, representing 22% of the population, had higher year-over-year claims.
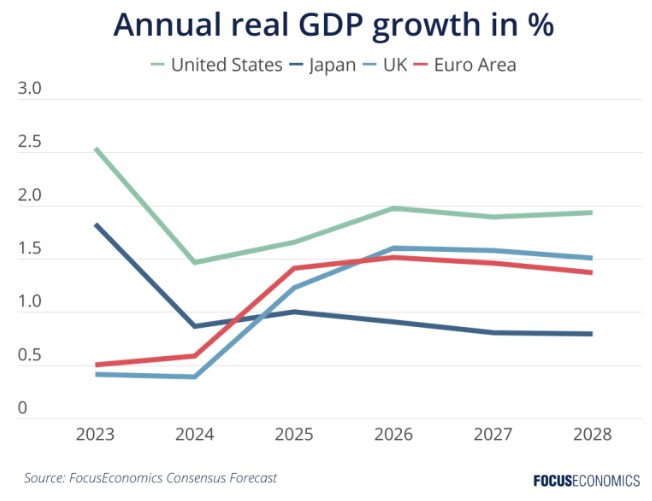
This trend is worth noting. The Leading Economic Index, which helps predict future economic trends, has been negative for 26 of the last 27 months. However, it has become less negative, indicating a slow recovery with US GDP growth expected to fall to 1% in Q3.
This is another data point suggesting that the Federal Reserve may need to lower interest rates.
Have a fantastic weekend, and always feel free to reach out this weekend if you have any questions.
-
Sometimes you need someone else to help you do things on your own.
The online world has given us a sense of unprecedented power. But therein lies the danger—we start to believe we can handle everything on our own, armed with just enough knowledge to be dangerous.
Lean on us, lean on the expertise of real estate agents. Ask questions and know that we are here for you when you’re ready.
Now back to our channel… Powell Spoke at the Economics Club of Washington DC and as we anticipated, he is looking more dovish(good) regarding rate cuts in September.
He was asked the question “what keeps you up at night” his response was “cutting rates too soon and inflation coming back vs cutting to late and causing a recession”.
The Feds are so Data Dependent, they may not see the forest through the trees until its too late. Looking for Cuts in September.

-
Comparison is the Thief of Joy. Holding onto rate gains.
The University of Michigan has released its Consumer Sentiment Index, showing a decline in consumer confidence from 68.2% to 66%. This marks the fourth consecutive drop.
Inflation expectations have decreased slightly from 3% to 2.9%, and the employment outlook remains weak. Additionally, spending intentions across various categories have also declined.
This trend indicates that consumers are becoming more discerning about their spending habits. The Consumer Price Index (CPI) has been adjusted from 2.5% to 1.4%, and import prices have been revised from 3.8% to 1%.
These are promising indicators that the Federal Reserve (FED) is monitoring closely ahead of potential rate cuts.
Though rates are far from their lows a few years ago, they are very much inline historically. Green is lower rate movement.
-
Go to the Light… Please
The Feds given yesterdays Soft Consumer Price Index inflation report, are starting to see the light and in favor of cutting rates sooner than later.
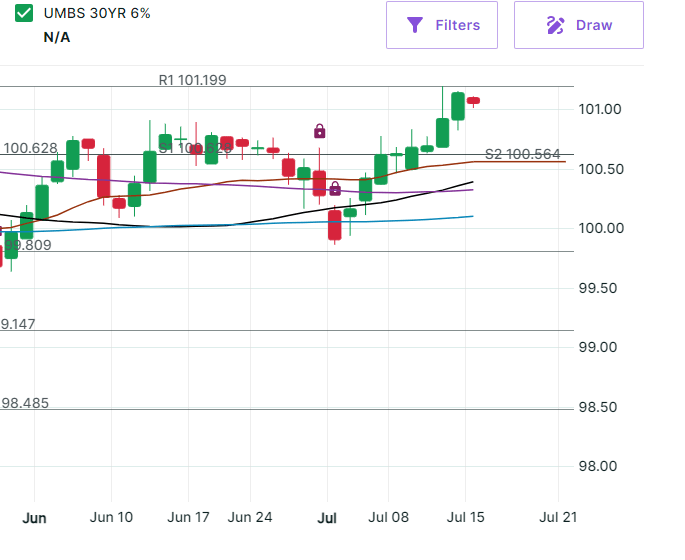
Today we see more rate improvement even from yesterdays big move.
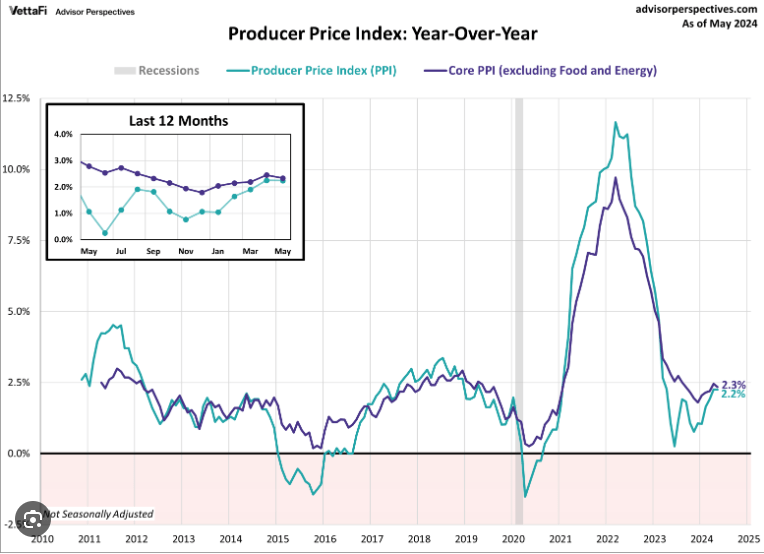
The Producer Price Index (PPI), which measures wholesale or producer inflation, rose by 0.4% in June, surpassing the expected 0.1%. Year-over-year, producer inflation increased from 2.4% to 2.6%.
The reasons behind this increase are not entirely clear and have raised some concerns. One theory is that as producers slow production, their suppliers are earning less and may be raising their prices, passing the additional costs on to the producers.
Bottom line is we are moving in the right direction regardless of the bumps in the road.
Have a fantastic weekend.
-
Subscribe
Subscribed
Already have a WordPress.com account? Log in now.
