-
‘A simple fact that is hard to learn is that the time to save money is when you have some.’ – Joe Moore
With that said, lets talk refinance and the raw numbers.
The example below is every point drop for a $100k loan start rate 7.50% Principle and Interest payment is $699 per month 30y term.
- @6.50% $632
- @5.50% $567
- @4.50% $506
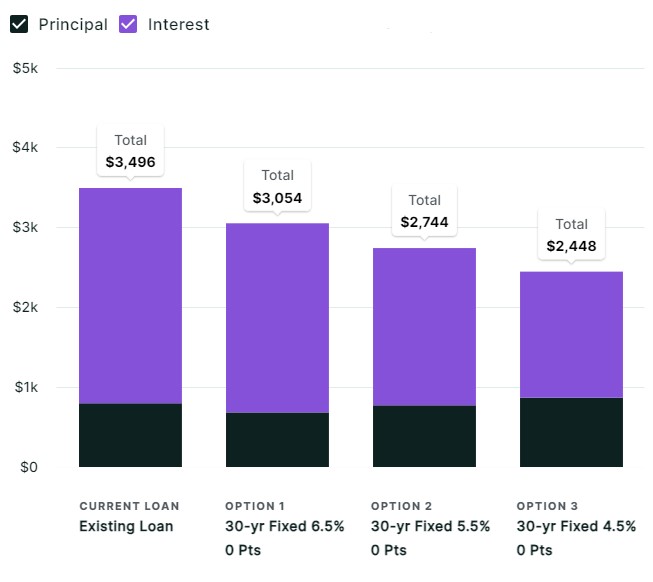
If you have a $500k loan 30y term monthly savings.
- @7.50% $3,496
- @6.50% $3,160 -Savings $336 annual savings $ 4,032
- @5.50% $2,838 -Savings $658 annual savings $ 7,896
- @4.50% $2,533 -Savings $963 annual savings $11,556
We do a soft credit pull and can get you pre-qualified now before the rates drop.
YourApplicationOnline.com click to apply for your custom graphical analysis.
-
It’s Not that the Wind is Blowing but WHAT the Wind is Blowing.
The 10-year Mortgage Bond is holding below 4%. This is a positive sign for Mortgage rates moving forward.
Fed Governor Michelle Bowman seems unaware of the shift in unemployment, which has risen from 3.4% in April 2023 to 4.3% today. To put this into context, every time unemployment has increased by that much since 1948, a recession has followed.
“the unemployment rate, while higher, is still historically low at 4.3%” – Michelle Bowman – voting member
Another aspect of the unemployment rate is how it’s collected and the participation level. The Business Survey, which provides the headline jobs figure, has seen a significant decline in participation, dropping from the usual 60% to 43%. Meanwhile, the Household Survey, which determines the unemployment rate, has also declined but still remains at 70%.
She goes on to talk about PCE and Core PCE still being above the target 2.0%.
This week, we’ll kick off with inflation data. The Producer Price Index (PPI), which measures wholesale inflation, is expected to rise by just 0.1% in July.
The year-over-year headline figure is projected to decrease from 2.6% to 2.3%. This is likely to be bond-friendly, indicating rate-friendly news.
My point is, when the wind is blowing, don’t just watch the trees swaying back and forth—look closer to see what’s actually hitting the trees.

-
Everything Matters, That’s why I don’t Care.
The weight of everything overwhelms its importance. What is the right choice? What if we are wrong? There is also a dilution of impact—if every action is critical, it becomes difficult to prioritize.
We need freedom or liberation from overthinking.
So, what am I getting at? Simply put, the Federal Reserve has overthought everything and needs to take a deep breath and step back. The Data is pointing to a slowing economy and lower inflation.
- Tom Barkin Richmond Fed President -Stock Market Selloff this week, Not something monumental. We can Steadily cut rates.
- Jeff Schmid Kansas City Fed President – Gives more confidence inflation headed to 2% goal.
- Austan Goolsbee Chicago Fed President – Central Bank’s policy is too tight.
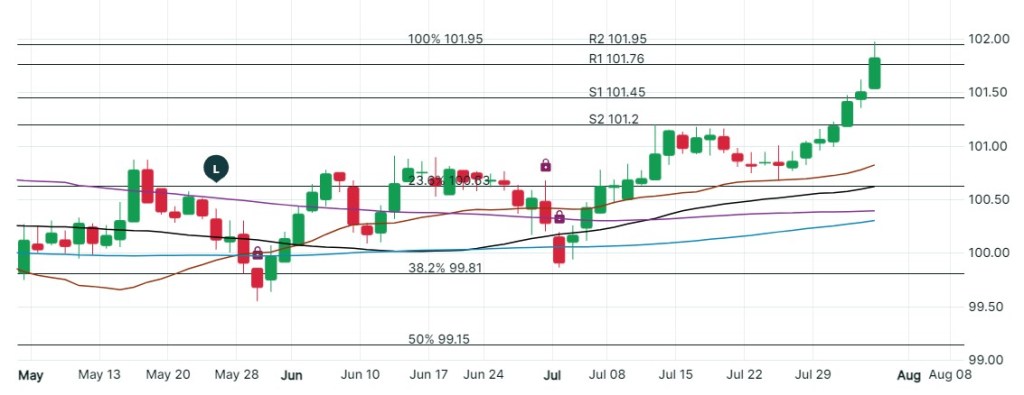
Below graph shows the rate improvement to the right. Up is lower rates. I am encouraging clients to get pre-approved for a refinance or purchase. we do soft credit pulls so no harm looking under the hood.
-
It’s Not about taking Advantage of Opportunities, It’s about being Prepared to recognize it.
The stock market has somewhat rebounded from the selloff on Monday.
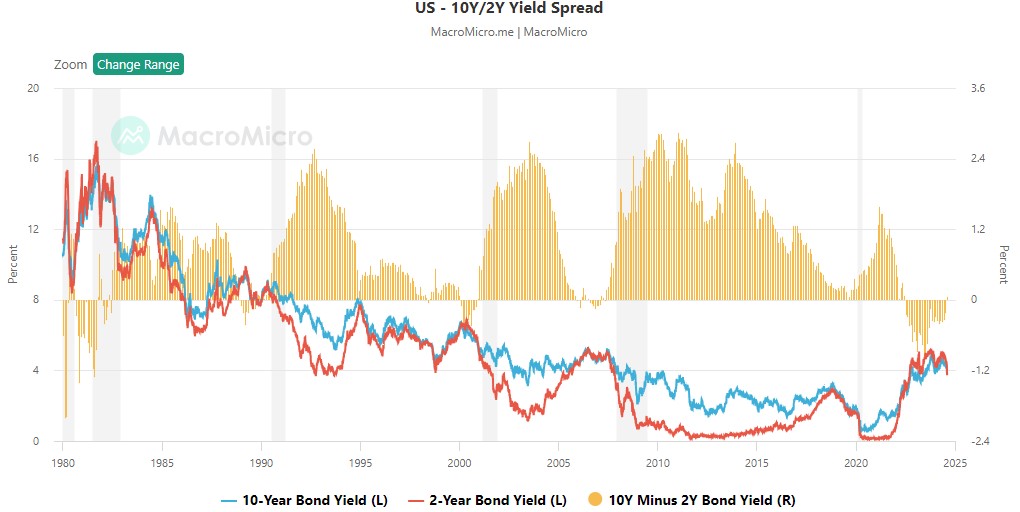
The 10-year and 2-year bond yields reversed the inverted curve this week, meaning the 10-year yield is now higher than the 2-year yield.
Here are two links to the same video I put together yesterday, on YouTube and TikTok.
-
Inverted Curve no more.
Sixteen of the nineteen members did not foresee the unemployment rate rising above 4.1% in 2024. We are now at 4.3%. Over the last two months, I have repeatedly emphasized the importance of understanding the real unemployment numbers and questioning the accuracy of the data.
I am genuinely surprised by the Fed’s initial Summary of Economic Projections.
The Federal Reserve has access to more detailed information than we do and is specifically qualified to interpret that data. It baffles me how they missed this when many of us were loudly warning anyone who would listen.
Here is the bottom line: the 10-year bond yield is back above the 2-year bond yield, as logic would dictate. Longer hold periods mean higher yields.
Rates have improved their gains from last week but remain somewhat volatile as the stock market reacts to the sell-off caused by the jobs report news.
-
Cut Wheat While it’s Sunny and the True Jobs picture.
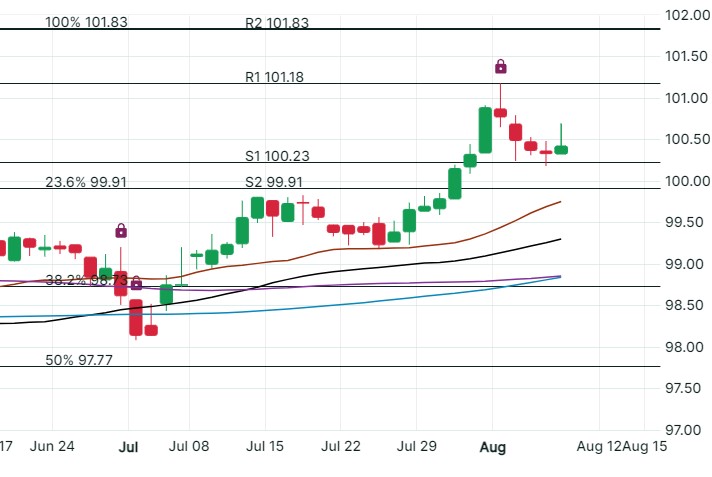
Mortgage rates continue to improve as real economic and job market data emerge.
Today, we’re seeing one of the biggest rate drops in six months. The graph below shows today’s movement, with green/up indicating lower rates.
the Bureau of Labor Statistics – BLS reported only 114,000 jobs created in July. Well below the 185,000 estimates. We also had 29,000 negative revisions to the previous two months.
BLS also relies on the faulty Birth/Death model which is notoriously inaccurate.
Truflation Inflation Data looks at 18M data points opposed to the 80k used by CPI and PCE inflation reports. Truflation is only showing year over year inflation at 1.5% vs 3% in CPI and 2.5% in PCE.
This week, I’ve outlined detailed reasons and strong indications that mortgage rates are likely to drop. It’s not smoke and mirrors.
When choosing your lender, ask them where interest rates come from and what they foresee for the future of rates.
Our team knows our stuff inside and out. When you’re ready, come on over and let’s talk.
-
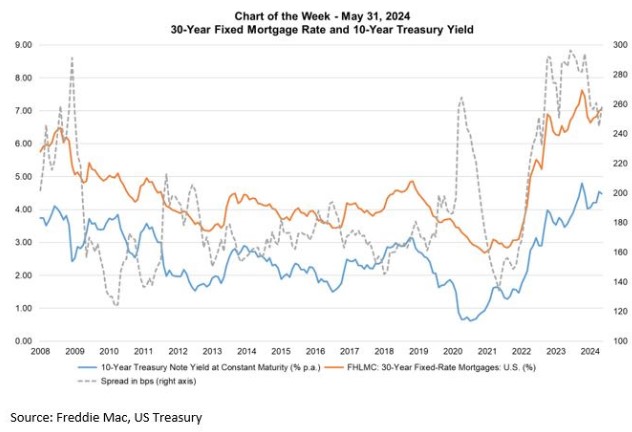
Bank of England just cut rates 25bp. Mortgage Rates and Yield spread tell an interesting story.
There is a spread between mortgage rates and the 10-year yields that is worth exploring. Currently, the spread is 260 basis points (bps), which is wide from a historical perspective.
This indicates that those holding these mortgages will likely refinance sooner rather than later. This is caused by the servicing premium associated with these loans. Lenders bake in that cost to protect against an early refinance.
As rates start to drop, so does the yield spread.
Currently, the 10-year yield is under 4% and likely to drop below 3.80%. When the 10-year yield falls to 3.80%, the spread narrows to 230 basis points. At that point, the 30-year fixed mortgage rates could fall to 6.125%. If the 10-year yield drops below 3.65%, those mortgage rates could hit 6% or lower.
The Federal Reserve met yesterday and sounded more dovish than before but still maintained the 2% inflation target. The Fed left rates unchanged unanimously. Powell’s comments below:
- We gained confidence on inflation, just want to see more good data
- We can afford to start dialing back restriction with current PCE at 2.5% and core at 2.6%
- The time is approaching, if we get the data we think, September cut is on the table.
Initial Jobless claims rose 14,000 to 249,000. This is the highest level in a year.
-
Quantitative Easing and Why we need to Pay Attention.
Quantitative Easing (QE) is a monetary policy used by central banks to buy assets in order to lower longer-term interest rates.
Quantitative Tightening (QT) is the opposite. It involves selling off those assets, which raises interest rates.
Quantitative Tightening has been implemented to unwind the massive number of bond holdings the Federal Reserve bought during the pandemic-driven recession when Quantitative Easing (buying bonds) was in place.
A quick history lesson: Between 2008 and 2014, the Federal Reserve became a massive buyer of Treasuries and mortgage-backed debt. This is Quantitative Easing at its finest, driven by the argument that it was necessary to maintain easy financial conditions for economic growth.
The Federal Reserve’s involvement in purchasing mortgage-backed securities extended beyond the scope of its traditional mandate. They needed to get rid of those bonds, and that is what Quantitative Tightening aims to accomplish.
The Treasury released their Refunding Announcement, which breaks down how much debt or Treasuries need to be issued in the coming quarters. Here is what the Treasury said:
They do not anticipate the need to increase the auction sizes (QT) for at least “the next several quarters”. This is an indicator of conditions typically associated with QE.
Bottom line: Mortgage rates are likely to drop this year. The extent of the decrease is uncertain, but it’s wise to be prepared.

-
Hewing to a greater sense of reality
As the Federal Reserve gains a stronger sense of the true reality, we see the writing on the wall. Rates will drop, the economy is slowing and the job market is a bit tougher than last year.
Home Appreciation Reports
Case Shiller Home Price Index, the industries Gold Standard, showed home prices rose 0.3% in May. Though this is seasonably adjusted the non-seasonally adjusted figure rose 0.9% on the month alone.
One of Case Shiller’s analysts, Brian D Luke Said:
“The waiting game for the possibility of favorable changes in lending rates continues to be costly for potential buyers as home prices march forward”.
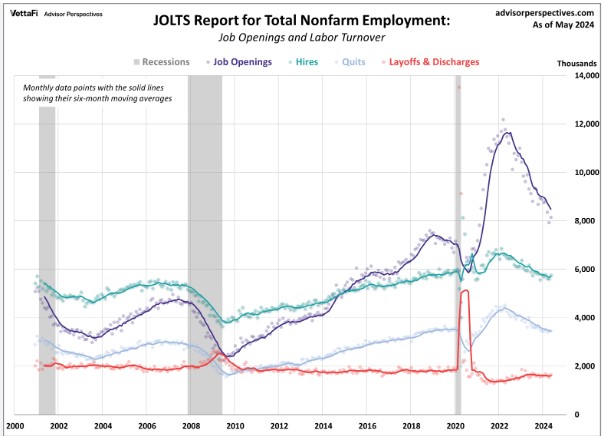
JOLTS
The June JOLTS data show job openings fell from 8.23M to 8.18M. For context we are above pre-pandemic levels, but remember the world has changed with our new work from anywhere issue of counting or double counting were the same job is listed in multiple states.
Consumer Confidence hit a high of 100.3, stronger than the 99.7% estimate. Confidence increased, but consumers are still generally negative about business and employment conditions ahead.
-
Excess Monetary Restraint. An argument for Wednesday FED rate cut.
That’s an exciting headline! I’ll do better tomorrow.
There’s whisper talk among the money managers who control vast resources of bond and pre-bond funds. Have you ever woken up in a cold sweat, knowing you should have done something the day before but still might have a chance to act on it?
That’s exactly what’s happening now. For the first time, I sense these long-term bond managers are sweating bullets. Should they buy now while the yields are still high, or wait and see what happens?
The Federal Reserve is also feeling that same cold sweat. Have they waited too long, or not long enough? The cure now seems worse than the ailment.
Below is the packed week of reports from Jobs to housing.
- Tuesday: Case Shiller HPI, FHFA, HPI and JOLTS
- Wednesday: ADP Employment, Pending Home Sales, Fed Meeting
- Thursday: Initial Jobless Claims
- Friday: BLS Jobs Report.

-
Subscribe
Subscribed
Already have a WordPress.com account? Log in now.
