-
Housing Market Cool Stats. 136M households in US, 91M homes Owned.
Lots of Stats below but worth the read.
- 136M total households in the US
- 91M homes owned (67% homeownership rate)
- 56.5M homes currently have a mortgage (62%)
- 34.5M owned free and clear (38%)
- 45M homes Rented (33%) – this one surprised me.
Average Homeowners with a mortgage have $311,000 in equity. And only 9900,000 homes with negative equity or 1.8% (this is a very low number).
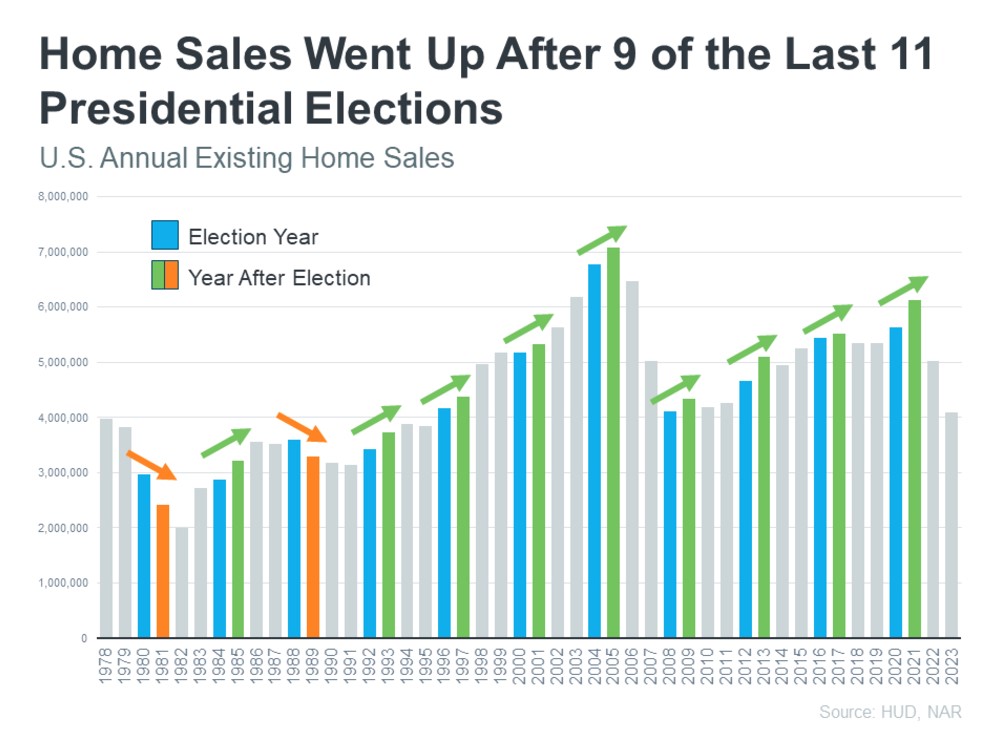
Appreciation forecasts from 150 top economist in the US.
- 2025 Average 3.78% ($18,900)
- Next 5 years Average 27.16% (135,000)
Housing continues to provide a meaningful wealth creation opportunity.
Tomorrow, the most important data point this week is the October Consumer Price Index (CPI). Estimates say flat or minimal inflation gains. This could affect rates.
-
What’s a bounce back Job? well lets find out. Click the link
Bounce back jobs is when an event like the Boeing strike and Sever Storms bring employees back to the workforce. It skews the numbers, sometimes more than expected.
November was one of those months. 227,000 jobs created – fairly typical but higher than expectations.
Here’s another interesting Job fact to talk about at the Holiday Parties:
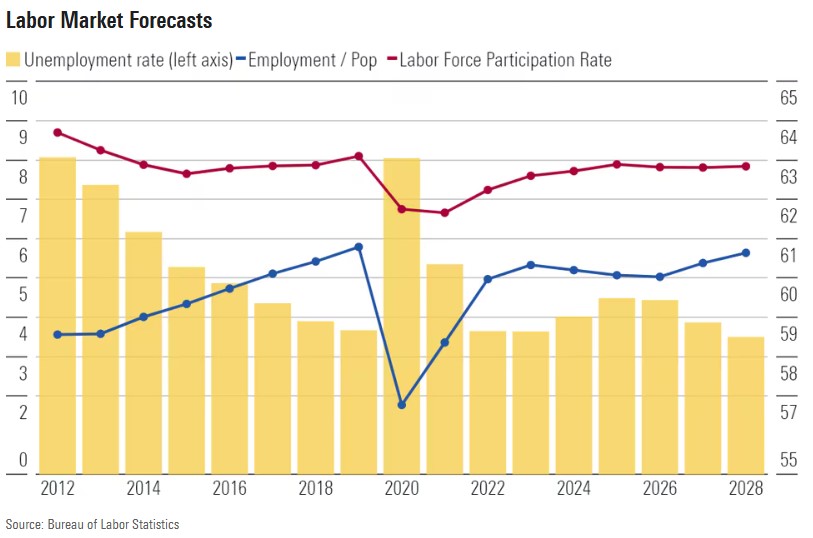
The number of unemployed people rose by 161,000, while the labor force shrank by 193,000. Consequently, the unemployment rate increased from 4.1% to 4.2%.
Here’s another way to look at it: the labor market is facing a headwind due to an aging workforce exiting the job market. This results in a shrinking pool of eligible workers while the number of unemployed people grows—a double whammy.
Well maybe not that interesting for Party chit chat, but it does show how complicated these number are.
The Bond Market had to dig through the weeds today to find the plant. And they did and reacted positively.
Rates continue to improve albeit slightly but in the right direction.
-
More Noise than Signal.
The sheer volume of data our industry processes to uncover that single spark of insight leading to the answer is immense—and no, for all you geeks out there, it’s not 42!
When are the Interest Rates going to Drop?
No one knows for certain, but we can make some educated guesses.
This week focused heavily on jobs reports. The ADP Employment Report came in weaker than expected, and October’s report was also revised lower. Most of the hiring occurred in large businesses.
Manufacturing lost 26,000 jobs, but the annual pay for job stayers—those who have remained in their jobs over the past year—rose by 4.8%.
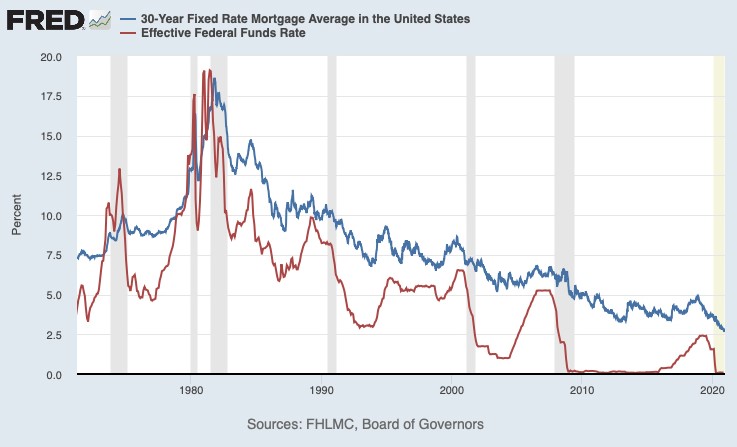
The Fed is set to meet on the 18th, with a consensus expectation that they will lower the Fed rate by 0.25%. While this is independent of mortgage rates—which are based on mortgage-backed securities (i.e., bonds)—it can still exert influence.
Consider the differential between the mortgage rate and the Fed rate. See below.
-
Jobs Jobs Jobs–JOLTS, ADP BLS and more – Lower Rates?
This week is pivotal for jobs data, as it will play a crucial role in the Federal Reserve’s upcoming rate cut decision on December 18th.
The data will offer valuable insight into the future trajectory of interest rates and the bond market.
What do we expect to happen this week.
- Job Openings increase slightly
- Quit rate to drop again, Lowest since 2015 (less people quitting their jobs)
- ADP lower job creations
- BLS jobs Report 195,000 new jobs.
These jobs reports will be a key driver of the bond market. As shown below, an upward trend indicates lower rates. If this trend continues through the week, it bodes well for future Federal Reserve rate cuts and lower mortgage rates.
-
Don’t take out your Contacts until you know where your Glasses are.
It was an interesting 15 minutes…
The upcoming release of Personal Consumption Expenditures (PCE) data is expected to dominate headlines in this shortened week. Projections indicate a slight uptick in year-over-year inflation, rising from 2.1% to 2.3%.
Meanwhile, the 10-year bond has responded favorably to the anticipated appointment of Scott Bessent as the new Treasury Secretary. His pro-business stance and reputation for fairness and pragmatism could signal a trend toward lower interest rates.
With some rate improvements already seen today, the combination of PCE data and a potentially supportive bond market outlook may pave the way for better rates in the near future.

-
Rates are Flat, Inflation Stubborn but will acquiesce.
ac·qui·esce /ˌakwēˈes/ verb
- accept something reluctantly but without protest.
The data indicates a consistent trend toward lower inflation, as shown by the CoreLogic Rental Index, which has decreased since the last report. However, this decline hasn’t yet been reflected in the latest Consumer Price Index (CPI).
If you’re an agent or lender, how do you address this with your clients? What narrative or guidance do you provide in this context?
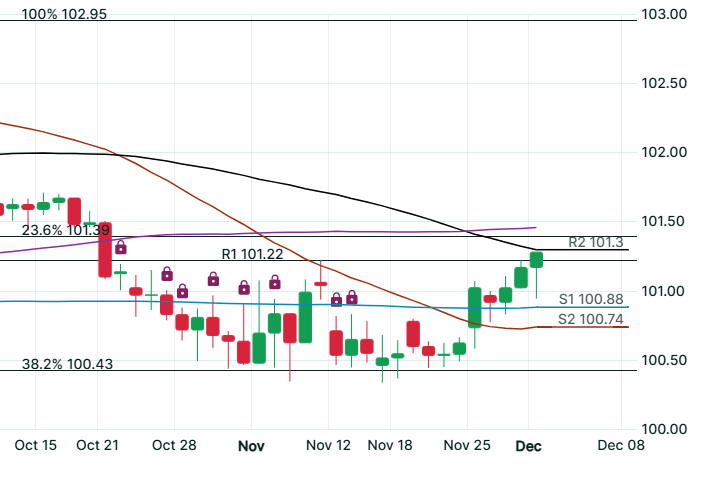
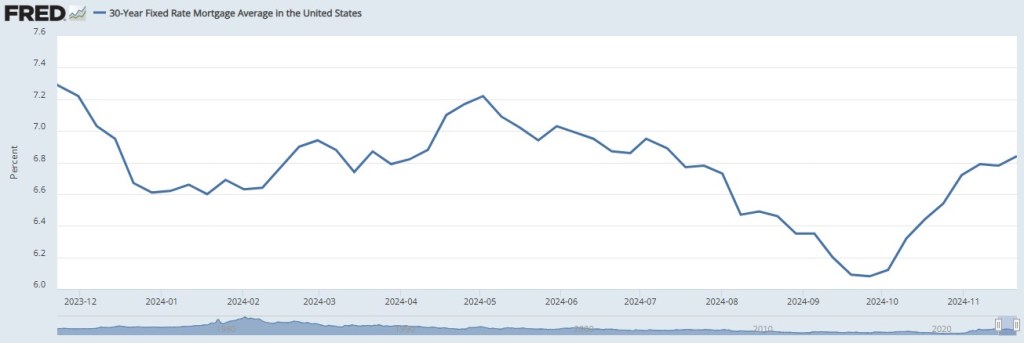
For perspective, here’s a look at rates over the past year: Nationally, rates are now below 6.875%, which aligns with historical averages.
Rates fluctuate daily, sometimes even hourly, and focusing solely on timing the market for the best rate overlooks the broader picture.
-
Bonds Flat NVIDIA earnings Ok with the Bond market.
Bonds are flat this morning which is good news. If NVIDIA took off it could have pressured the Bond market as NVIDIA is the largest component of the S&P 500.
*would have pulled more money away from the bond market
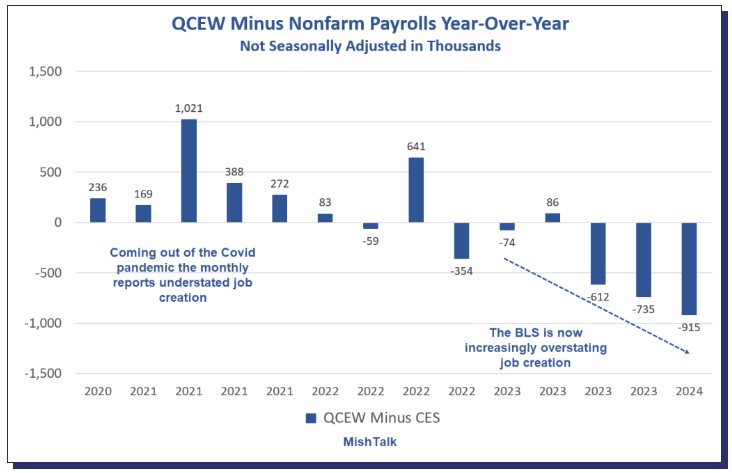
Job Data Revisions yet again. The Quarterly Census of Employment and Wages QCEW released their numbers and is showing more significant downward revisions in the labor market.
What does this mean? Basically the jobs growth has been over stated significantly. The challenge is the FED members keep stating how strong the labor market is.
Rates are flat so far this week.
http://www.YourApplicationOnline.com
-
NVIDIA Earnings Report and the Bond Market.
This was fascinating and highlights how much emotions and greed play a significant role in the stock market.
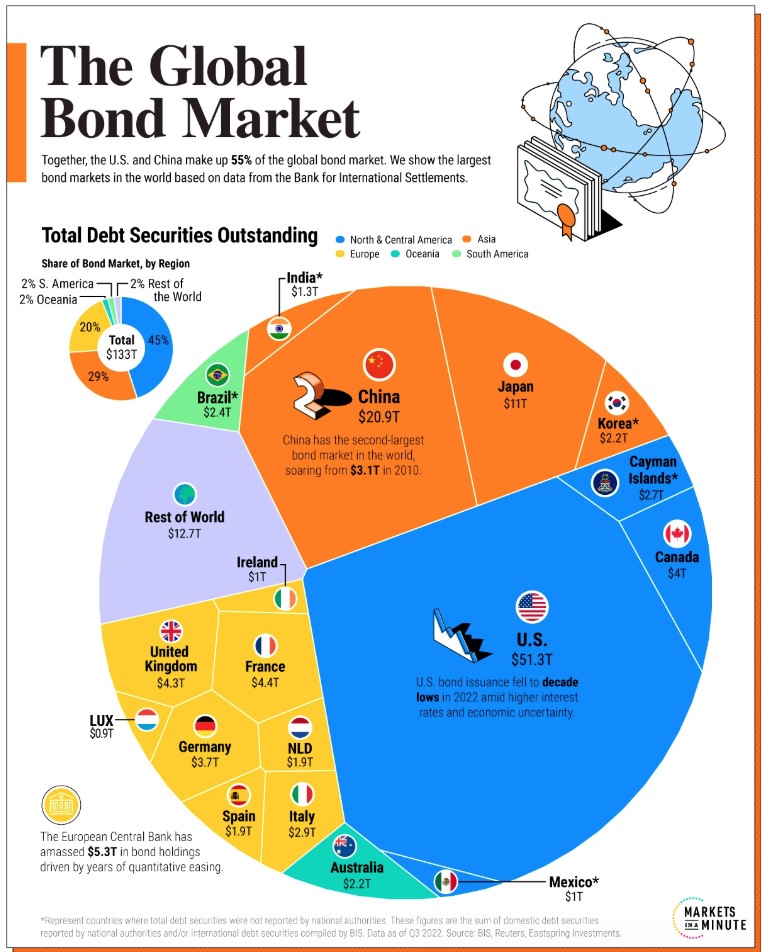
54% of the available global assets are in the Bond Market with 46% in the Stock Market –Data SIFMA. $140.7 trillion in Bond and $115 trillion in Stock Market.
Nvidia has emerged as a leader in the AI boom, with its stock prices soaring dramatically. Similar to the crypto market, these entities have become highly appealing to money managers, often drawing capital away from the bond market, which has consequently suffered.
Nvidia’s earnings report after the bell will reveal the next move for money managers. If they fall short of expectations, we may see a shift toward safer investments, such as the bond market.
http://www.YourApplicationOnline.com
-
PPI is up, Jobless Claims are Down So what’s a Bond to Do?
Producer Price Index was slightly hotter than expected. This is the cost of the producer to produce goods and services. A preamble to the Personal Consumption Expenditures (PCE) due out 27th of November.
Initial Jobless Claims are down for the first time as well as Continuing Claims.
The Bond Market is just not sure what to do with itself.
Rates increased the last two weeks and are not budging off those levels.
We will see how this all shakes out the next two months.
Check out this graph—it’s so detailed you’ll need a microscope just to find the title!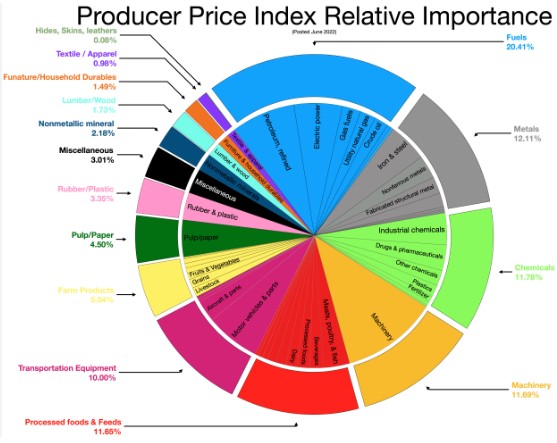
-
Inflation report came in As Expected. This is huge.
Mortgage rates have taken a beating in recent weeks, so this bit of good news—or at least no bad news—is welcome.
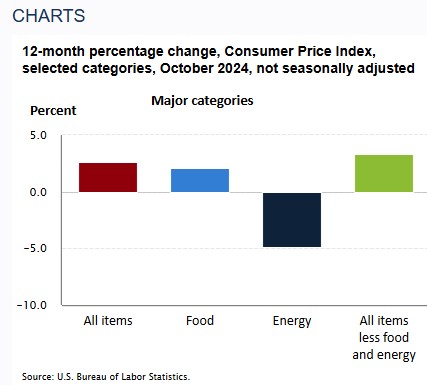
The October Consumer Price Index (CPI) report showed overall inflation rose by 0.24%, with the annual rate ticking up slightly from 2.4% to 2.6%. Two main factors driving this increase were a surprising 2.7% rise in used car prices and, as expected for the holiday season, higher airline fares.
Meanwhile, mortgage applications dropped 6.8% as rates climbed to an average of 6.84%. However, purchase applications specifically rose by 1%, which is encouraging news.
We do soft credit pulls for mortgage pre approvals.


-
Subscribe
Subscribed
Already have a WordPress.com account? Log in now.
