-
BLS, Birth/Death Model and what the Jobs reports really mean.
I’m not here to sugarcoat it, so let’s rip off the Band-Aid.
The Bureau of Labor Statistics (BLS) reported 151,000 jobs created, falling short of the 170,000 estimate. Notably, 136,000 of those jobs came from the Birth/Death model, which estimates employment changes based on business openings and closures—a flawed measure of true job growth.
What does this mean for us? Rates are likely to drop as investors seek safety, driving more money into the bond market.
Let’s break down the job shifts: 1.2 million full-time jobs were lost, while 610,000 part-time jobs were added. Notably, all job gains came from the 16–19 age group, totaling 80,000, while employment for those 20 and older declined by 667,000.
The headlines reflect the reality on the ground. This trend has caught the Fed’s attention, with the market now pricing in three rate cuts this year.
https://YourApplicationOnline.com
-
ECB cut rates 25bp today. What happened and will it continue here.
After inflation concerns fueled by tariffs and tariff threats, the European Central Bank (ECB) cut interest rates by 25 basis points today.
Was this the right decision, or should they have held steady? Any knee-jerk reaction comes with consequences.
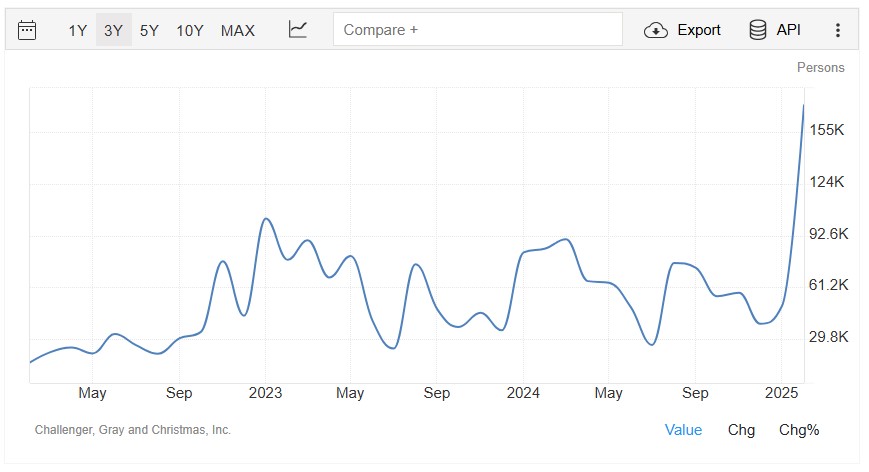
The Challenger Job Cuts Report revealed 172,017 announced job cuts last month—the highest since 2009. Government cuts, particularly in the DOGE sector, contributed to this rise, along with layoffs in retail and technology.
Meanwhile, the leisure and hospitality sector saw job growth, largely due to rebound hiring after weather-related slowdowns in December and January.
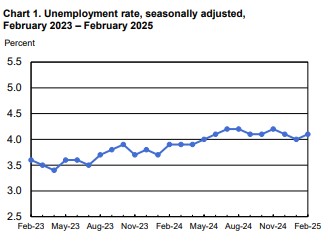
Given the historical correlation between the Challenger report and the Bureau of Labor Statistics (BLS) Jobs Report, we anticipate a weaker BLS report tomorrow.
Historically, the Jobs Report has had a direct impact on the bond market—stronger-than-expected numbers push rates higher, while weaker results drive them lower. We expect a softer report and unemployment to hold steady at 4%. This could well translate to lower rates tomorrow.
http://www.YourApplicationOnline.com
-
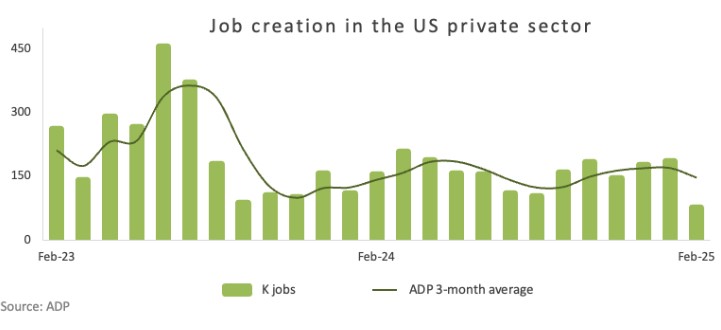
ADP Jobs Report 77,000 jobs Created, expected 140,000.
- Trade/transportation/utilities -33,000
- Information -14,000
- Financial Activities 26,000
- Professional/business services 27,000
- Education/health services -28,000
- Leisure/hospitality 41,000
The ADP report was weaker than expected, helping bonds recover from news out of Germany regarding a proposed rule change that would allow increased defense and investment spending—an inflationary factor.
Mortgage applications are up mainly due to the lower interest rates over the past few weeks.
We can help, soft credit pull no harm to credit. http://www.YourApplicationOnline.com
-
Tariffs, Oil Prices, and interest rates Oh My…
OPEC plans to gradually increase production starting in April. Since oil influences nearly every aspect of the Consumer Price Index and other inflation-related metrics, this shift could have widespread economic effects.
In response, the bond market moved in a rate-positive direction.
As for tariffs, while the media often focuses on fear-driven narratives, the reality is more nuanced. Most goods we buy and sell contain components sourced from various parts of the world, which means the actual impact of a 20% or 25% tariff will likely be less severe than the headline figures suggest.
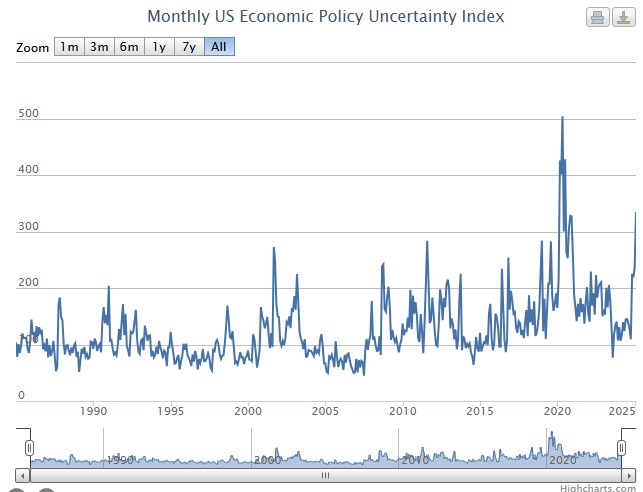
The Uncertainty Index rose significantly the last week including today. This and the new fear of a recession is something the FEDs cant ignore. the Fed rate may be lowered as soon as May.
In my view, things are rarely as bad or as good as they seem, but the uncertainty is undeniable. Ultimately, this trend points toward lower mortgage rates.
-
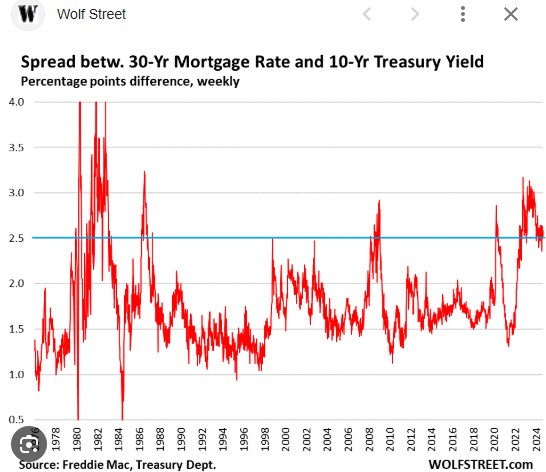
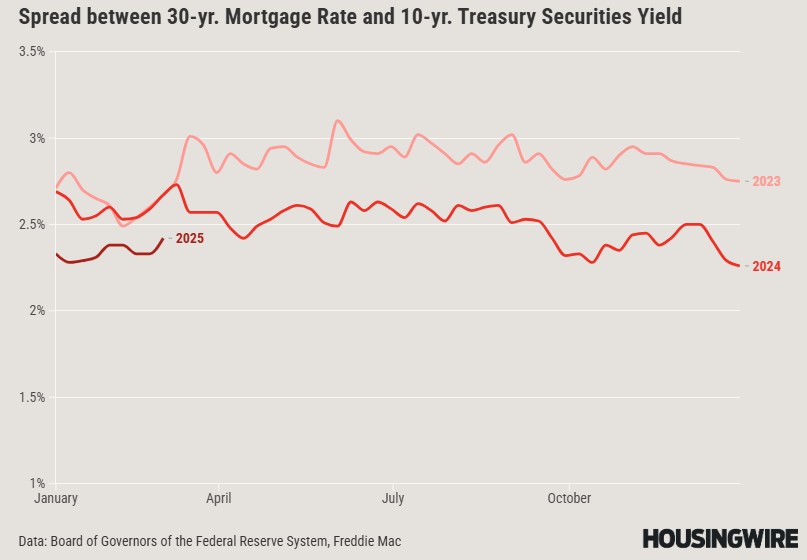
The Spread is Important. It’s the Differential between the 10y an Rates that’s the tell.
Mortgage rates are influenced not only by the 10-year bond yield but also by the spread between the 10-year yield and the actual mortgage rates offered on the street.
The spread between 30-year mortgage rates and 10-year Treasury yields has remained elevated in recent years, peaking at 2.96% in June 2023.
Now, not only are mortgage rates declining, but the spread between mortgage rates and bond yields is also tightening.
Why does this spread increase? It all comes down to risk. When interest rates rise, the likelihood of future declines grows. If borrowers refinance too quickly, it impacts the long-term return on those mortgages, affecting both lenders and servicers.
To mitigate this risk, mortgage rates are set higher relative to bond yields, creating a buffer against potential refinancing. A higher rate means more interest paid upfront, helping offset future losses.
Rates are dropping as is the differential. Its a positive double whammy.
Lets get you qualified. Soft Credit Pull http://www.YourApplicationOnline.com
-
It’s All that it tells us, and All that it Refuses to tell us. Let’s talk “Risk Off Trade”
Investors are shifting away from riskier assets like stocks and crypto, moving their money into the bond market—a phenomenon known as “Flight to Safety.”
A “risk-off” trade is exactly what it sounds like—when uncertainty rises, investors pull back. While the stock market may be exciting, the bond market offers a sense of security—like a cozy home with warm cookies and milk.
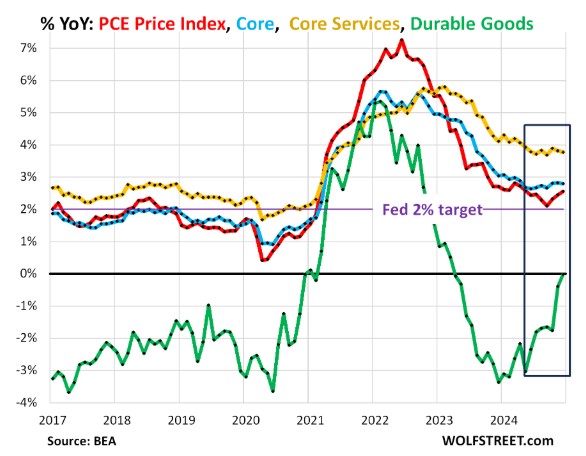
The Personal Consumption Expenditures (PCE) report showed headline inflation rising 0.3% for the month, while year-over-year inflation eased from 2.6% to 2.5%, aligning with expectations.
The core PCE, which excludes food and energy costs, also increased by 0.3% for the month, with annual inflation declining from 2.9% to 2.6%.
As inflation does, so does the interest rates.
-
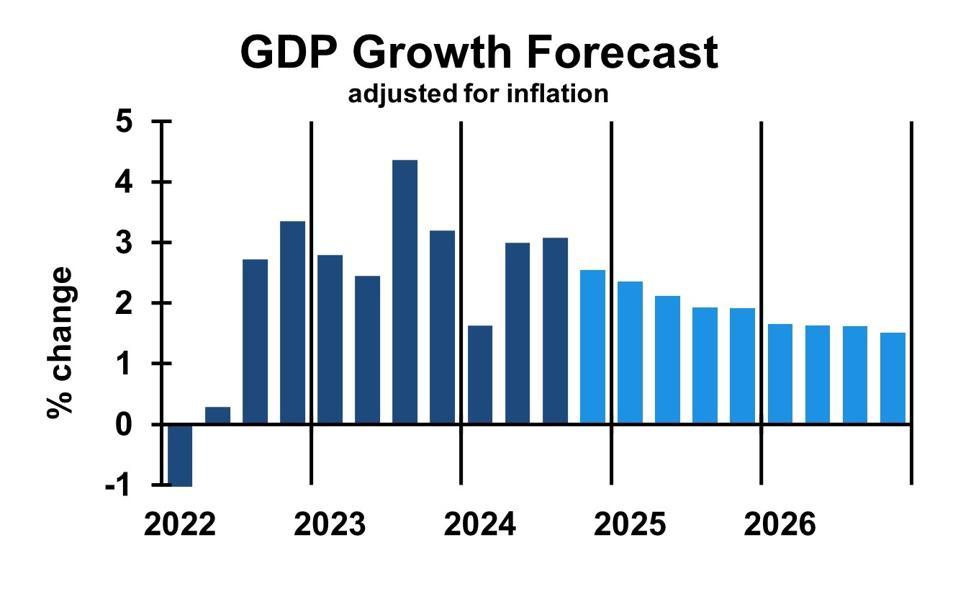
GDP is like a bathroom scale – it might tell you you’re getting bigger, but it doesn’t tell you if you’re actually getting healthier.
Gross Domestic Product – Q4 2024 was inline with expectations at 2.3%. But may not tell the whole story. Q1 and Q2 should give us insights on Tariffs and the Federal workers being fired or laid off.
Factors affecting GDP
- Consumer spending Increased consumer spending contributed to the increase in GDP in the fourth quarter.
- Government spending Increased government spending contributed to the increase in GDP in the fourth quarter. But will change.
- InvestmentA decrease in investment partly offset the increase in GDP in the fourth quarter.
- Imports Imports decreased, which is a subtraction in the calculation of GDP.
Business investment
Business investment has been relatively strong since the start of 2024. Markets expect the incoming administration to further boost the attractiveness of business investment.
-
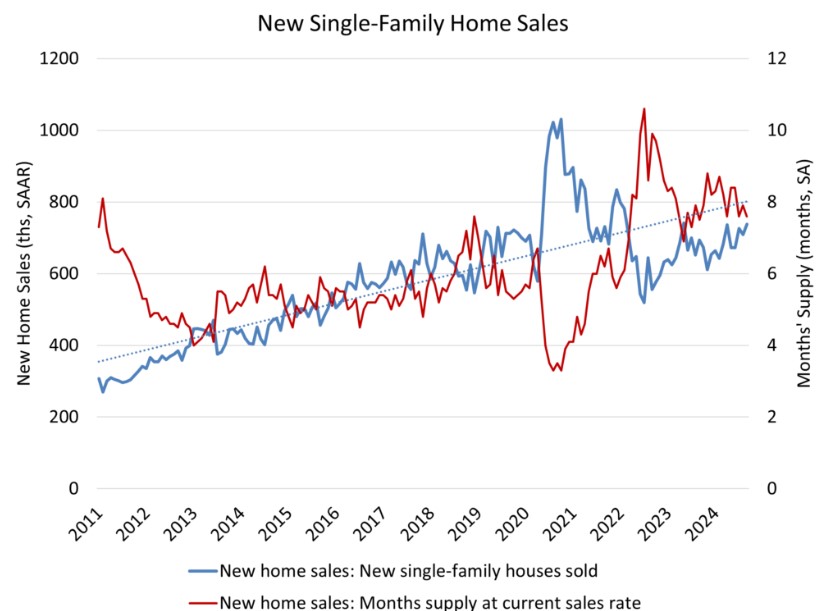
New Home Sales are weird. I mean Strange. What’s the actual number?
New Home Sales Decline 10.5%, But Supply Tells a Different Story
Recent data shows that new home sales fell by 10.5%, a steeper decline than expected. Meanwhile, the supply of new homes has increased from 8 months to 9 months.
However, out of the 657,000 homes counted in inventory, only 115,000 are completed, while 106,000 haven’t even started construction—and some may never be built.
This means the actual available supply has effectively decreased by 2.1 months, making the housing market even tighter than it appears.
Builders are growing cautious. With rates lingering around 7% and no clear path to lower levels, they are proceeding with caution and hedging their bets.
-
$600k purchase last year, increased value by $24k today.
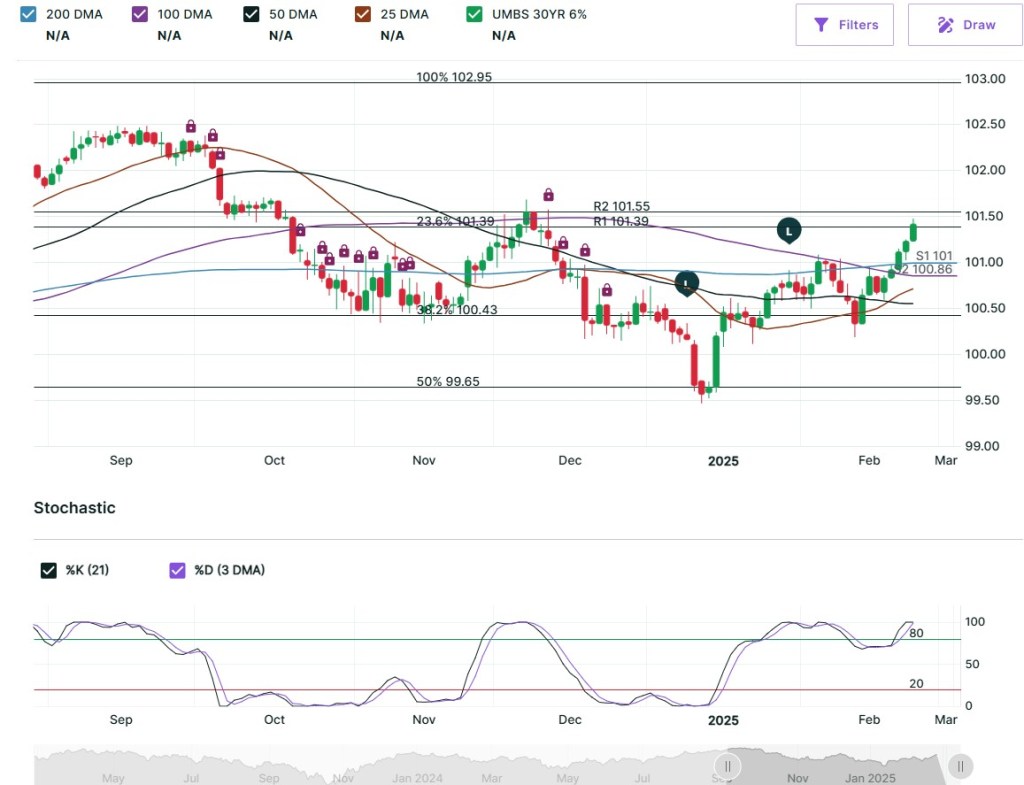
The Case-Shiller Home Price Index, widely regarded as the gold standard for measuring home appreciation, reported a 0.5% increase in home prices for December, with a 3.9% rise year over year.
Meanwhile, the Federal Housing Finance Agency (FHFA) released its House Price Index, which excludes cash buyers and jumbo loans, focusing instead on single-family homes with conforming loan amounts. According to this report, home prices have increased by 4.7%, reflecting continued market strength. A 4% appreciation is a solid indicator of a healthy housing market.
On the mortgage front, Bond prices have risen significantly over the past week, leading to lower yields and, in turn, lower mortgage rates. We’re hopeful this trend continues, especially with the upcoming PCE report on Friday, which could have a major impact on rate movements.
Lower rates ahead? Let’s stay tuned.
On the Chart, up ie Green is lower rates.
-
But now I am Six. I’m as clever as clever, So I think I’ll be six now for ever and ever. – A. A. Milne
There is a charm and simplicity to this poem. But just as growing up is inevitable, so is the change in the mortgage industry.
Rates fluctuate, regulations evolve, and the market conditions shift.
Professionals and homeowners must embrace change rather than try to “stay six forever”. -Adaptability.
All eyes are on Friday’s release of the Personal Consumption Expenditures (PCE) report, which measures U.S. household spending on goods and services.
Markets anticipate a drop in inflation from 2.6% to 2.5%, a welcome sign for the bond market and interest rates.

-
Subscribe
Subscribed
Already have a WordPress.com account? Log in now.
