ADP’s private payroll data, released this morning, showed higher growth than anticipated, with 184,000 jobs added in March compared to estimates of 155,000.
Bond traders are currently pricing in a 62% chance of the first Fed rate cut in June, down from 70% last week according to the CME FedWatch Tool.
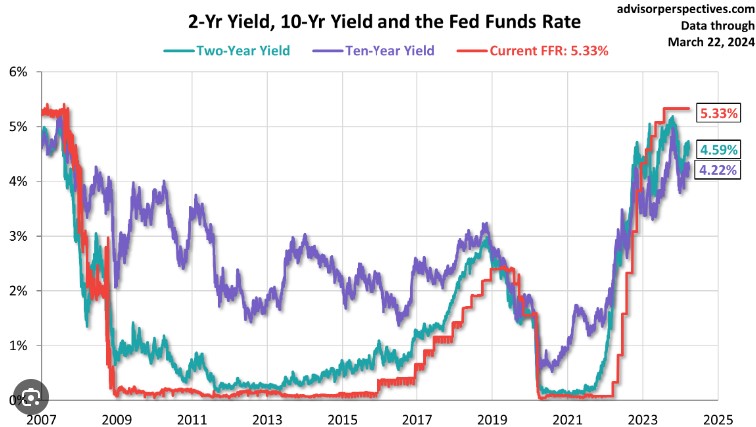
As the Bond Yields go, so goes the Mortgage Rates.
The graph below provides a clear illustration of the current and historical trends of the Fed rate, closely correlating with mortgage rates.
Chicago Fed President Austan Goolsbee, whom we’ve discussed before, stated this morning that he was in favor of three rate cuts this year. He emphasized:
“The Fed needs to strike a balance between its dual mandate of employment and inflation.”
Atlanta Fed President and voting member Raphael Bostic had a slightly different tune, advocating for one rate cut this year. He mentioned:
“I expect little or no change in the current 3.9% unemployment rate.”
Translation: If the unemployment rate increases, he may support more rate cuts.
New home sales remain stable at a 662,000 annualized pace, which is positive news, with sales up 5.9% year over year.
Here’s an interesting observation regarding the median new home price, reported at $400,500, down 3.5% from January and 7.6% from last year. While the initial reaction may suggest a downturn, it’s primarily a statistical adjustment due to the sale of lower-priced homes. Additionally, only 24% of builders reduced home prices, down from 36% in December, according to the NAHB.
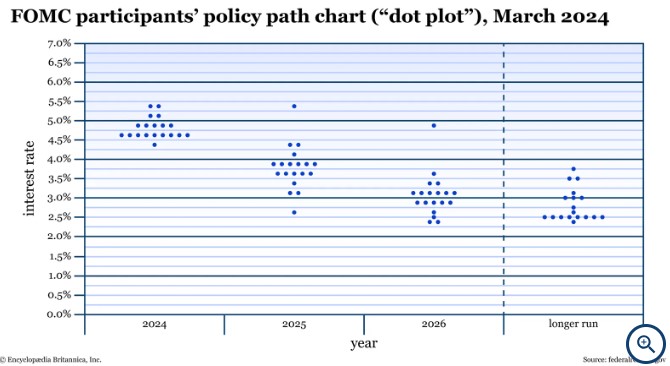
My perspective on all of this is that the data is available; we just need a bit more time to validate it. Below Fed Dot Plot. Voting members forward indication of future Fed Rates.
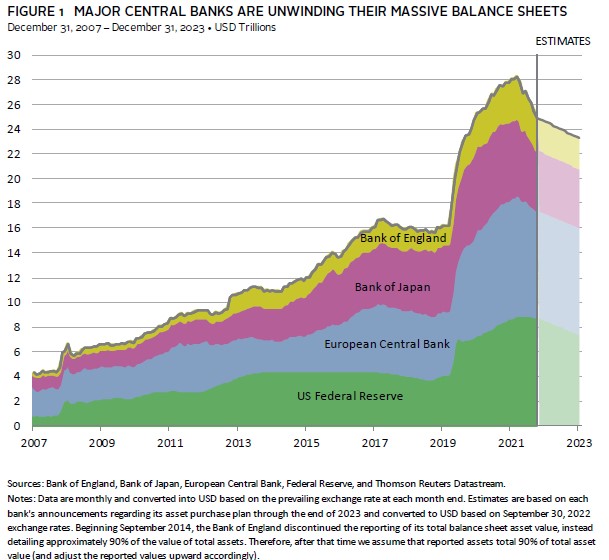
We’ve previously discussed Quantitative Easing (QE) and Quantitative Tightening (QT), but let’s recap. QE and QT are monetary policies that either increase or decrease the central bank’s balance sheet. QE expands the balance sheet, whereas QT contracts it to curb inflation by raising interest rates.
The Federal Reserve has indicated the necessity to slow QT and shift towards a QE stance, thereby expanding their balance sheet and subsequently cutting rates.
Another persistent inflationary factor in the CPI is shelter costs. It’s important to note that while CPI examines around 80,000 data points for rents, Truflation measures over 10 million data points. Truflation indicates a 2.07% increase in rents, as opposed to the CPI’s reported 5.7%. We’re aware that there’s a lag in this data, and this should be reflected in upcoming CPI reports.
Overall, I foresee a trend towards lower Federal Reserve rates, inflation nearing 2.0%, QE on the horizon, and with the NAR Settlement, potentially increased inventory.