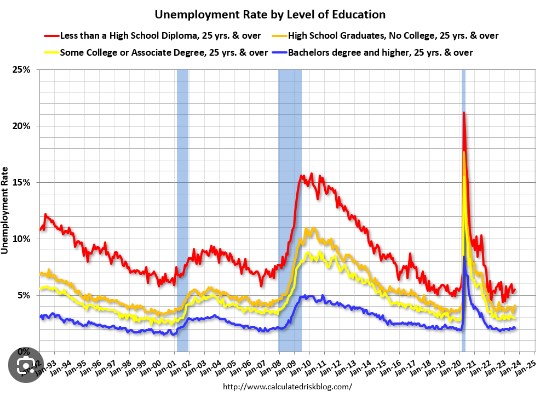
The BLS report showed an increase of 275,000 jobs in the month of February. The expectation was 200,000. The Unemployment rate inched up to 3.9% from 3.7%.
Weekly earnings up 0.4% for the month and up 3.7% year over year.
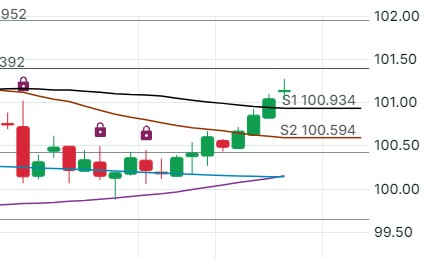
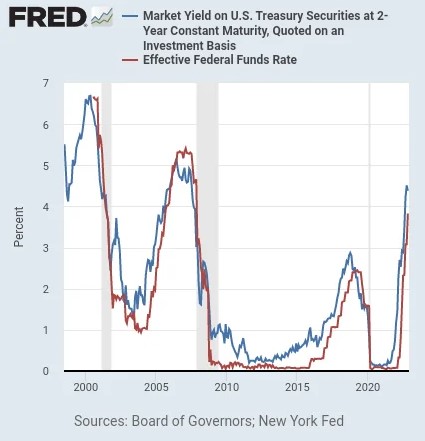
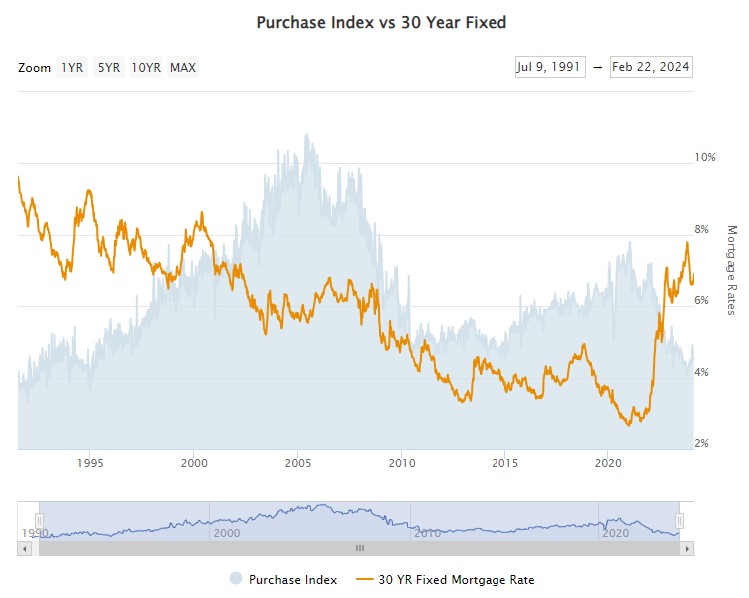
How does this affect the Bond market? See graph below. UP is LOWER rates.
Rate Improvement helps get buyers and sellers off the couch.
Stock Market is up and ADP Employment Report is in. We are slightly off expectations of 150,000 jobs created in the private sector. January was 111,000.
Mortgage applications are up 9.7% as are refinance applications. Still lower than last year but the trend is there.
Job Stayers pay increased 5.1%, while Job Changers saw an increase of 7.6%. This was the first increase in 19 months.
Powell’s prepared remarks did not shed light on his future actions other than there is not enough confidence that inflation is moving sustainably towards 2%.
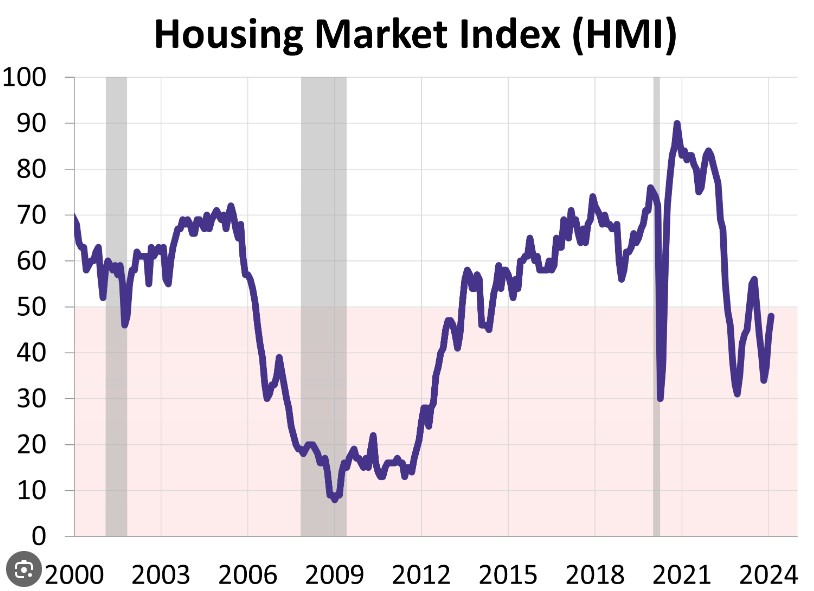
One bright light is the Housing Market Index – HMI report.
Every month, the National Association of Home Builders (NAHB) and Wells Fargo survey NAHB members for their Housing Market Index (HMI) report.
This survey gives a sense of the single-family-home environment and looks at three components. Current home sales, Home sales over the next six months and traffic of prospective buyers. This is measured on a 0-100 scale.
February’s score was 48 up from 44 in January and 42 the year prior. This is the highest rate since August 2023.
Building permits hit a seasonally adjusted annual rate up 8.6% year over year.
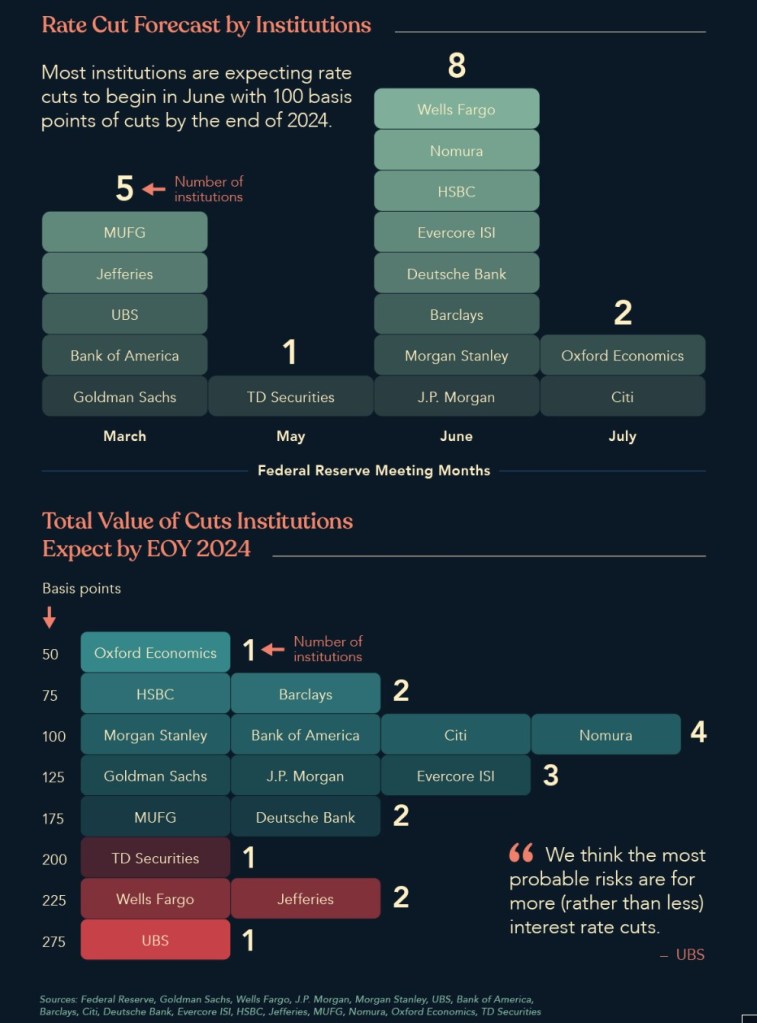
With the anticipation of Fed rates dropping this summer, the builders have taken notice and appear to be maintaining their positive outlook.
Acting impulsively without thinking about the consequences. Reflection without reaction is what the FEDs are doing.
As an Engineer for the first part of my life, we called this Analysis Paralyzes. It’s the inability to make a decision out of fear of making the wrong decision.
We can see the data and what the street is telling us. Even if the unemployment rate is historically low, employees have a fear of changing jobs or leaving without a new job. In this case the workforce becomes stagnant.
From my perspective it feels like the world is waiting for the FEDs to start lowering the FEDs Fund Rate before they commit to the future. We are sitting in limbo and that’s not a fun place to be.
The ISM Manufacturing Index which measures the health of the service industry decreased to 47.8%. We are now 16 consecutive months with contractions.
This means the economy is slowing as expected with the continued high FED rate.
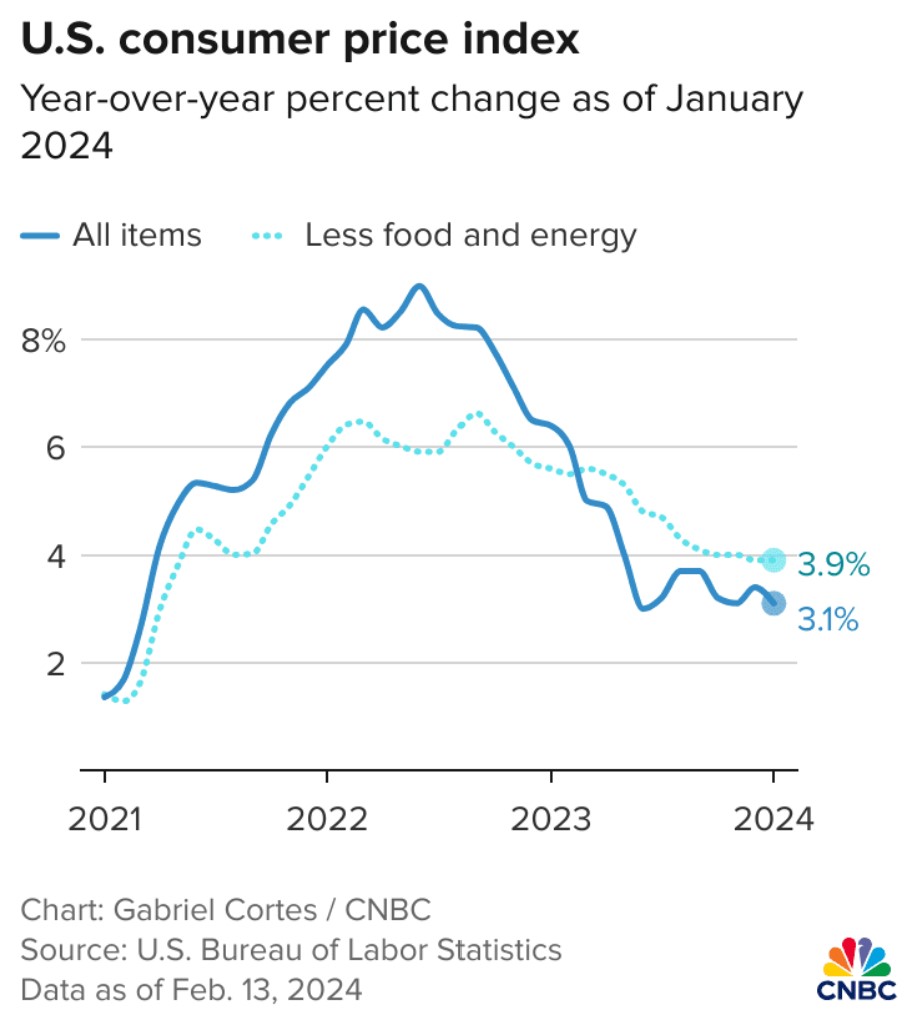
The Consumer Price Index has a huge component being Shelter Costs. It makes up 45% of the Core Index. The problem is those numbers incorporate Owners Equivalent Rent (OER) which is 1/3 of the CPI number.
Here is the question and I want you to answer:
“if someone were to rent your home today, how much do you think it would be for rent for monthly, unfurnished and without utilities?”
How could we possibly be tracking Consumer Prices for Shelter if we are asking a question we are guessing at. The difference between the actual rent costs and the OER are diverging.
One of the reasons is the OER peeps are single family home owners not multi family renters. A bit perplexing.
Ok, it’s Friday and I am ranting… Have a fantastic weekend and rates are improving.
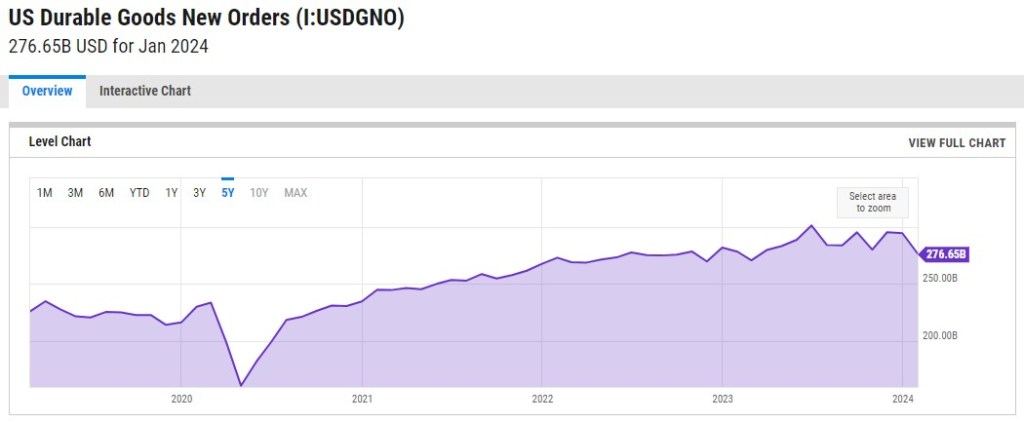
First lets define what this is. “Durable goods orders are new orders placed with domestic manufacturers for the delivery of long-lasting manufactured goods. The Census Bureau releases durable goods orders monthly as an economic indicator.”
The data is in: New orders decreased by 6.1% in January, a larger drop than the anticipated 4.5%.
Initially, this might trigger panic. It’s a significant decline. However, when viewed from a long-term perspective, orders remain substantially higher than pre-pandemic levels.
The Feds will see this as more data helping them lean into future rate drops.