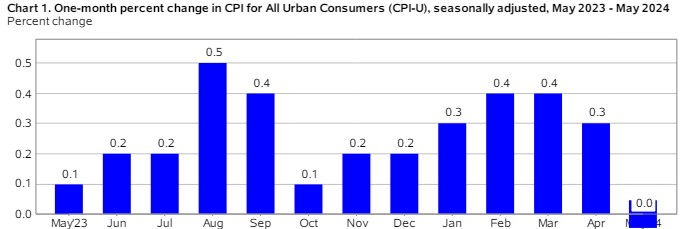
May Consumer Price Index (CPI) reported zero inflation for the month. The estimate was 0.1%. This is significant and a powerful indicator for the Feds to start lowering their rate.
Looking at the Year over Year, almost all the inflation that was present was from Shelter and Motor Vehicle insurance.
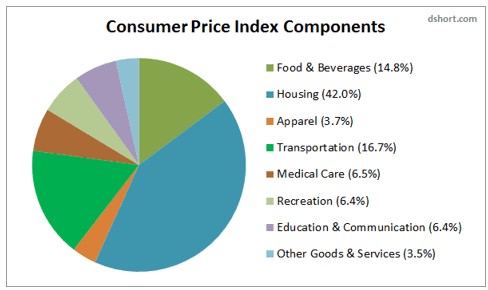
Everything else only rose 0.21% from last year. Let that sink in. Shelter cost make up 45% of the core index.
Today the feds will be meeting to talk about rate future rate cuts. We do not expect any cuts this month or summer.
The unexpectedly high job gains reported by the Bureau of Labor Statistics (BLS) in May can be attributed significantly to the Birth/Death model adjustments. This model plays a crucial role in estimating employment changes that arise from the natural churn of businesses starting up and shutting down. Here’s a detailed breakdown of the situation:
Birth/Death Model Overview
The Birth/Death model is designed to account for the dynamic nature of the business landscape. It estimates the number of jobs created by new businesses (births) and the number of jobs lost due to business closures (deaths). This model is particularly important because real-time data on new businesses and closures is not immediately available, and these factors significantly impact overall employment figures.
Impact on May’s Job Report
In May, the BLS reported a total of 272,000 jobs created, which significantly surpassed the estimated 185,000 jobs. Out of these 272,000 jobs, a substantial portion—231,000 jobs—were attributed to the Birth/Death model adjustments. This suggests that the majority of the reported job gains were derived from the model’s estimates rather than direct data from business surveys.
Why the Huge Job Gains?
Economic Recovery and Expansion: The economy might be experiencing a phase of robust recovery or expansion, leading to the creation of numerous new businesses. As these businesses start operations, they contribute to job creation, which the Birth/Death model captures.
Data Estimation Methods: The Birth/Death model relies on historical data and statistical techniques to make its estimates. If there are significant deviations from past trends or unexpected economic developments, the model’s estimates might be larger than anticipated.
Seasonal Adjustments: The model incorporates seasonal adjustments to account for regular fluctuations in business activity. These adjustments can sometimes lead to higher estimates during certain times of the year.
The Dilemma
The challenge with relying heavily on the Birth/Death model is that it is an estimation tool. While it helps provide a more complete picture of employment changes, there is inherent uncertainty because it is based on statistical projections rather than direct measurements. This can lead to discrepancies and debates over the accuracy of the reported figures.
Reliability Concerns: Critics argue that the model might overestimate job gains if it does not accurately reflect the current economic conditions or if there is an unexpected downturn in business activity.
Adjustment Lag: The model’s estimates are based on past data, which means there can be a lag in reflecting real-time economic changes. Rapid economic shifts, such as those seen during economic recoveries or recessions, can make the model’s projections less reliable.
Conclusion
The significant job gains reported in May are largely driven by the Birth/Death model’s estimates of new business activity. While this model is essential for capturing the dynamic nature of the labor market, its reliance on historical data and statistical methods introduces a level of uncertainty. Therefore, while the reported figures suggest strong job growth, they should be interpreted with caution, understanding the underlying estimation processes and potential limitations of the Birth/Death model.
The recent JOLTS report revealed a decline in job openings, particularly noticeable in the Leisure and Hospitality sector with a decrease of 109,000 openings—a sector that had previously shown robust job growth.
Despite this, the Labor Turnover or Quit rate has remained steady at 2.2% for the sixth consecutive month, reflecting an overall softness in the labor market.
Looking ahead, if the upcoming ADP and BLS Jobs Report indicates lower numbers as anticipated, and the unemployment rate surpasses 4%, there could be further improvements in rates.
On a different note, both the CoreLogic Home Price Insights and Black Knight HPI have reported heightened home values, with April showing a 1.1% increase following a 1.2% rise in March. Black Knight specifically noted a 5.1% year-over-year increase.
Over the years, I have observed a convergence of various factors in the industry. Consumers today are more cautious and discerning about their spending habits, choosing when and where to allocate their funds wisely.
With eight OPEC+ producers planning to ramp up production in the coming months this should lead to reduced oil prices and easing the energy component of inflation.
It seems that the Federal Reserve’s sought-after data and trends are aligning, providing a clearer picture of the economic landscape.
Personal Consumption Expenditures (PCE) came in as expected. Inflation rose by 0.3%. The year-over-year inflation also remained the same at 2.7%. A significant part of that was due to the increase in energy costs. We had expected a decline in inflation.
Let’s take a closer look at these numbers. The core rate, which excludes food and energy costs, rose by 0.2%, but it actually increased by 0.249%, rounded down to 0.2%. The year-over-year inflation number is not 2.7% but actually 2.75%, again rounded down.
The larger question is why are we looking that closely? If you are going to win, win big. Swimming competitions can come down to 1/100th of a second. Do you know what that is? That’s two coats of paint.
Inflation is no longer trending upwards, and we anticipate it will decline as the year progresses.
Rates continue to improve this week. Have a great weekend and enjoy the Sun.
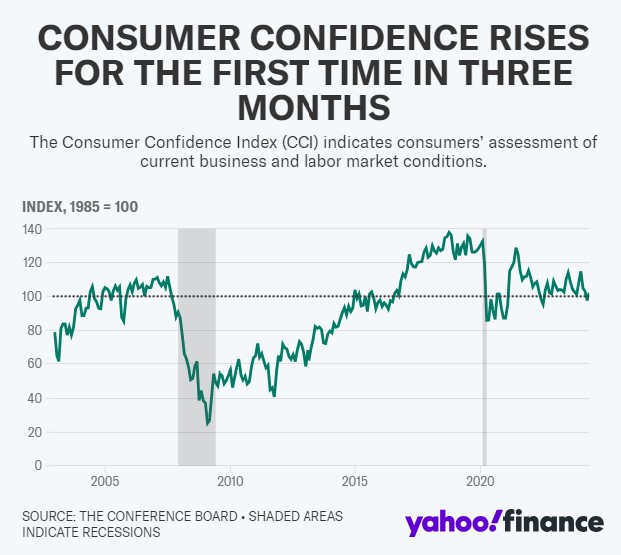
Those with money and property are reaping the benefits of the high-interest rate environment. Yields on savings accounts have surpassed 4.5%, and low housing inventory has driven home values to unprecedented heights. The stock market has also seen remarkable gains, with the NYSE hitting 40,000 for the first time. The S&P 500 rose 23% last year and is up over 11% this year.
When I see the Consumer Confidence Index (CCI) rise above 100, I can’t help but wonder how it’s possible.
There is a segment of the population that is very content to keep things exactly as they are.
The Federal Reserve faces a dilemma. Plans for home purchases are at their lowest level since August 2012, and lower-income consumers are being hit the hardest.
High Federal Reserve rates might be causing inflation rather than curing it. The economy is being driven by the wealthy, particularly those earning $100,000 or more. This group comprises 37.43% of households, totaling 49,281,397 households.
Case Shiller Home Price Index, year over year 6.5%.
FHFA House Price Index year over year 6.7%.
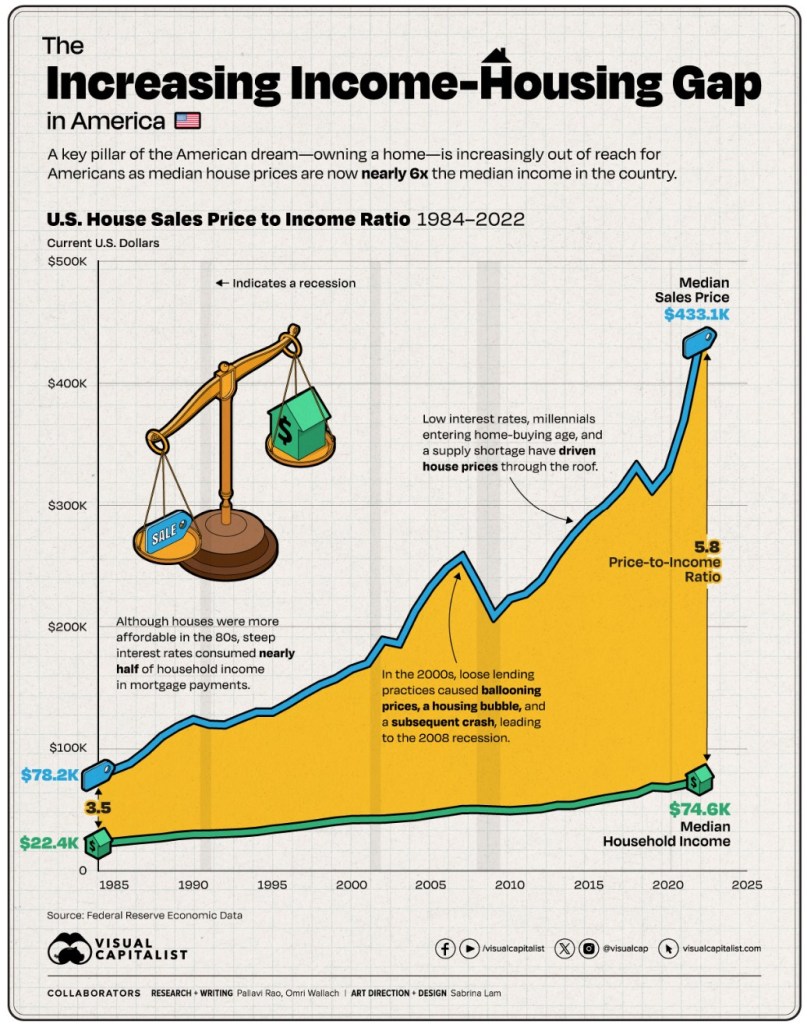
The problem is that the affordability gap continues to widen, driven by the persistent housing shortage. Incomes can’t keep up, so something has to give.
It’s a conundrum. Lower interest rates enable sellers to sell and buyers to buy. This frenzy can lead to skyrocketing prices as more buyers emerge. We saw this happen in 2020 when rates dropped.
I believe that lower rates will encourage sellers to finally put their homes on the market. Many of my clients are ready to sell. Some bought during the pandemic and have since realized their new location no longer suits them. Others are looking to downsize or upsize.
Even though close to 30% of the home purchases are first time home buyers, quite a number of them are getting help from their parents to make up the Price to Income gap.
The market reacts to the news not the revision. When we look at inflation as an example, we always couch it in terms of “year over year”. But most of the other numbers and gauged by “month over month”.
A good example is todays Durable Goods Orders. We expected -0.8%. What we got was a rise of 0.7%. The market, specifically the Bond market saw the 1.5% differential and reacted accordingly (negatively).
Last months reading of 2.6% was revised lower by 1.8% bringing March to 0.8%. The actual reading today fell -1.0% which was worse than the expected -0.8%.
Another example: Core Durable Goods rose 0.3%, which was stronger than the estimates of 0.1%. There was a negative revision from the previous month of 0.3%, which brought March to -0.1%. When factoring that in, the reading was 0.0%, lower than the expected 0.1% stated above.
The Bond Market, which is what rates are based on, reacts to the headline not the math. The consumers are slowing their roll. First it was Retail Sales and now its Durable Goods.
Walmart and Target both announced store wide price cuts. Others will follow and inflation will drop.
The Train is coming but the Feds are too busy looking in the rear view mirror to realize they are parked on the track.
Fed Minutes can be a bit frustrating to read. Here is an example.
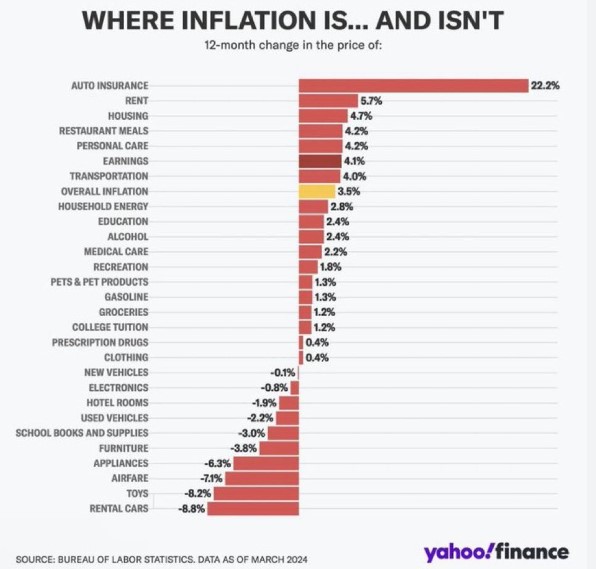
“Some participants emphasize that the recent increases in inflation had been relatively Broad Based”.
Take a look at the graph below. The top three items are Auto Insurance, Rent, and Housing. Housing and Transportation make up 58.7% of the Consumer Price Index (CPI).
If we pull these out, inflation is only up 0.27% year over year. This is not broad-based but specific.
Inflation is stubborn, that is true, but its makeup is also as important.
The bond market reacted to the news today on Initial Jobless Claims and the Fed Minutes. Rates slipped but only a bit.
Raphael Bostic a voting member and Fed President said he thinks inflation will continue to come down, but slowly. He has talked to a lot of business leaders, and they are all telling him that things are slowing down.
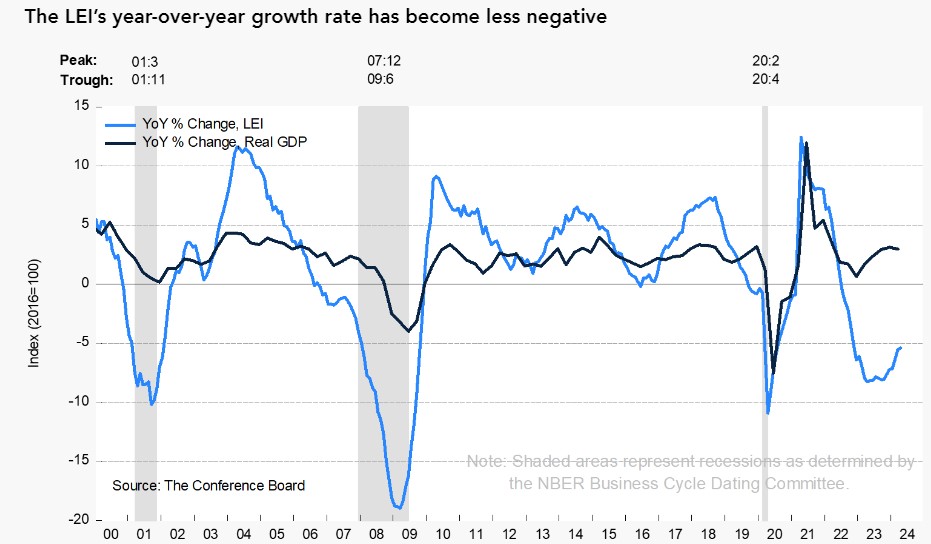
Leading Economic Index
The Conference Board released their LEI, which decreased in April by 0.6%. We have had 22 months of negative readings in a row. This points to serious headwinds to growth ahead.
What’s going on this week
Tuesday: CoreLogic Rent Index
Wednesday: Mortgage Apps, Existing Home Sales, 20-year bond Auction, Fed Minutes
Thursday: initial Jobless Claims, New Home Sales
Friday: Durable goods Orders.
How will this affect Mortgage Rates?
What the Federal Reserve is hearing from the market aligns with the broader economic observations both anecdotally and technically. This indicates that the Fed is analyzing the data and recognizing that a recession may not be imminent. However, they might need to reconsider implementing rate cuts sooner rather than later.
Translation
Mortgage Rates should move in a positive direction moving forward.