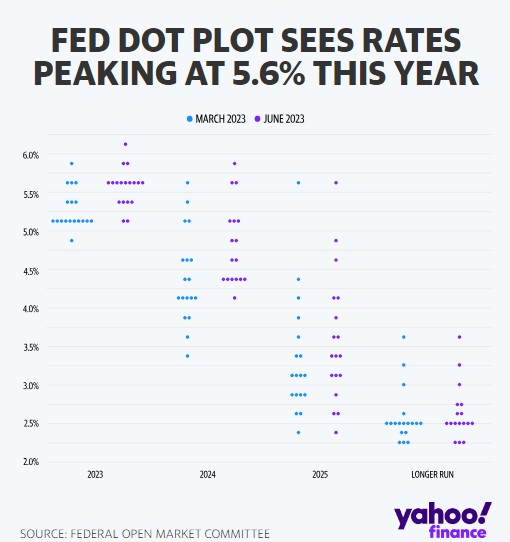
The Fed Dots Plot is a chart that shows you where each FOMC – Fed Open Market Committee member thinks interest rates will be by the end of the current year, two consecutive years after, and the more ambiguous “longer run.” Each “dot” represents a member’s individual view.
The graph below is the March and June Plot. Later today we will see the FOMC members projections.
What you are seeing is a strong consensus that the Fed rate will drop in 2024.
We have new projections on GDP, the unemployment rate, PCE Inflation and the new Dots Plot.
Look for Tomorrows post for mor information.
Are you Purchasing or refinancing? happy to help.
