The Consumer Price Index (CPI) Which measures inflation on the consumer level, reported at 0.4% inline with expectations and more importantly a decrease in inflation or 0.1% to 4.9% year over year.
I often get phone calls with the same question “what are rates today”
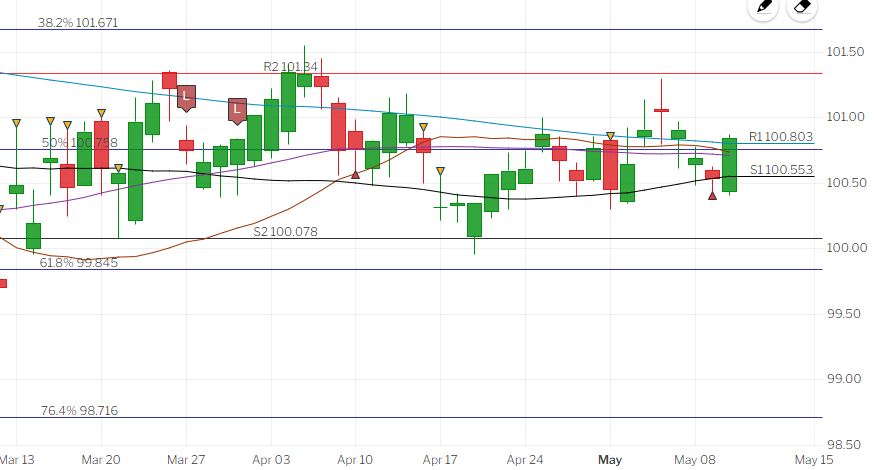
This is what we look at everyday. Green is rate improvement, Red the opposite. What is fascinating is how cyclical it is (UMBS 30yr 5.5% chart). Up is lower rates.
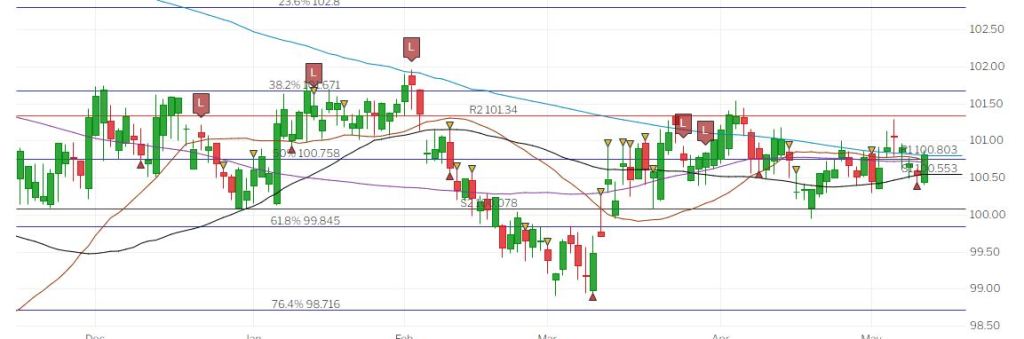
If I keep looking back, let’s say 6 months, I get this chart.
It’s not just what’s the rate, it’s when is the rate, when should I lock, or should I float for a few days. Ask your lender these hard questions, then ask me and let’s see what the difference is.
Its Wednesday, headed to a Real Estate weekly meeting this morning.
